Ensuring Image Quality
Norman Koren and Randy Bockrath
All imaging systems, from medical devices to mobile phones and military targeting systems, use a combination of image sensors, optical systems, and image-processing hardware. To optimize the image quality of these systems, engineers must measure the image quality that results from any given combination of components.

Since product data from suppliers is generated using a variety of methods, it is often difficult to compare quality and performance. To do so, the parameters used for image-quality measurements need to be carefully specified. Even when suppliers provide image-quality metrics with their products, buyers must repeat such tests to confirm quality and to compare products.
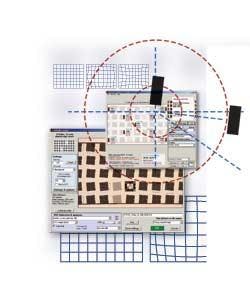
The most efficient approach to evaluating image system quality is to acquire and analyze images of test charts that contain features for measuring at least one, and preferably several, of the key factors of interest. Charts and software that combine measurements can expedite testing and reduce cost. An example of this is the Imatest SFRplus test chart, which contains a grid of slanted edges that conform to the ISO 12233 standard (see Fig. 1).
Because it has many more edges than the standard ISO chart, a map of system response can be produced. The chart also contains solid bars at the top and bottom to measure distortion, a step chart for measuring tonal response and gamma, and regions for measuring for light fall-off (response uniformity).
To test imaging systems, a well focused, uniformly lit, glare-free image of the chart must be captured. Regions within the image can then be selected either manually or automatically, depending on the software used. These regions can then be analyzed to determine image-quality metrics.
Using Imatest software, a variety of image-quality factors can be analyzed including image sharpness, color response, noise, dynamic range, tonal response, lens flare, lens distortion, lens vignetting, sensor nonuniformity, and color moiré.
Imatest’s SFRplus module employs object-recognition technology to automatically select regions of the test chart to be analyzed (see Fig. 2). Nine regions of interest indicated by purple rectangles that contain slanted edges—one near the center, four partway to the corners, and four near the corners—have been automatically selected by the software.
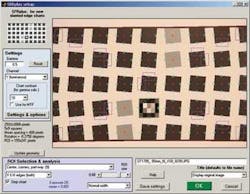
Depending on user settings, the software selects between 1 and 23 regions of interest for analysis, allowing the entire imaging field to be analyzed. After the settings and regions are selected, interactive image analysis can be performed or the settings can be saved to produce an automated test. In interactive mode, the software calculates all the image-quality factors available on the test chart and displays the results graphically. These can then be saved as image or Excel files.
Three tests
Sharpness is arguably the most important image-quality factor as it is most closely related to the amount of detail an image can render. Sharpness is defined by the boundaries between zones of different tones or colors. The relative contrast at a given spatial frequency (output contrast/input contrast) is called the modulation transfer function (MTF) or spatial frequency response (SFR).
Two of the best indicators of perceived image sharpness are the spatial frequencies where MTF is 50% of its low frequency value (MTF50) or 50% of its peak value (MTF50P). These numbers are often the same, but they may differ for strongly sharpened systems. Other measures of sharpness are often desired (e.g., MTF20, the spatial frequencies where MTF is 20% of its low frequency value), which is closer to the traditional vanishing resolution (roughly MTF10, which is often obscured by noise).
Chromatic aberration (CA) is one of several aberrations that degrade lens performance. Others include coma, astigmatism, and curvature of field. Chromatic aberration occurs because the index of refraction of glass varies with the wavelength of light—glass bends different colors by different amounts (see Fig. 3). Although minimizing chromatic aberration is one of the goals of lens design, it remains a problem, most notably in ultrawide angle, long telephoto, and extreme zoom lenses. Lateral chromatic aberration is the color fringing that occurs because the magnification of the image changes with wavelength. This is more visible near the edges on the image.
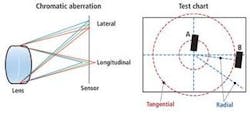
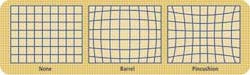
Distortion is an aberration that causes straight lines to curve and has two forms: barrel and pincushion (see Fig. 4). Distortion tends to be most serious in extreme wide angle, telephoto, and zoom lenses. It can be highly visible on tangential lines near the boundaries of the image, but it is not visible on radial lines. In a well centered lens, distortion is symmetrical about the center of the image. Lenses can, however, be decentered due to poor manufacturing quality or shock damage.
Sharpness, aberration, and distortion
The display of Imatest SFRplus results (see Fig. 5) provides test results for sharpness, lateral chromatic aberration, and distortion. The selected regions of interest are surrounded by red rectangles and shown with full contrast. Four results boxes next to each region display location, sharpness, and chromatic aberration metrics across the imaging field.
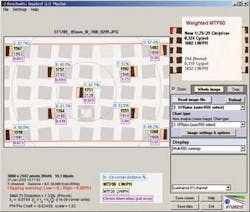
Distortion statistics are shown in the lower left. Here, Standard Mobile Imaging Architecture (SMIA) TV distortion (www.smia-forum.org) is the simplest overall measure of distortion. Although this figure is twice the traditional TV distortion definition, it has been widely adopted in the mobile imaging industry.
Dotted circles within the chart delimit the central region (up to 30% of the center-to-corner distance), the partway region, and the corner region (more than 75% of the center-to-corner distance). The weighted MTF50 is then the weighted mean of the mean MTFs in the three areas, where the weights are 1 (central), 0.75 (partway), and 0.25 (corner). The chart was developed because approximately nine regions (four in the center, center, one partway out, four at the corners) are sufficient to characterize lens performance. In Fig. 5, linewidths per picture height (LW/PH), a measure that equals to 2 lp/mm, is used to provide an indication of image sharpness.
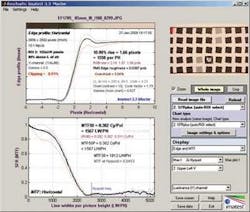
Many other displays are available that provide additional image quality details. For example, Fig. 6 shows the mean edge and MTF response for one of the vertical edges in the test chart, as represented by the curve in the graph. The slight overshoot on the edge and the bump in the MTF response are indicative of moderate amounts of software sharpening. This display is available for any of the selected edges (center, partway out, or corners).
Finally, lateral chromatic aberration, noise statistics, and subjective quality factor (SQF; a measure of perceived print quality) can be displayed for each selected image. Tonal response and spatial uniformity profiles (tonal uniformity and color shading) can also be displayed for the entire image. These displays can be selected from drop-down menus or results can be saved in image files and Excel-readable data files.
Software integration
To be most effective, image-testing software must often be integrated with in-house software systems, popular software packages, and imaging devices and hardware. In some cases, the need to integrate image-testing software with complex existing systems and devices may make in-house software development more attractive. Yet in other cases, third-party software may be well suited to integration needs.
To speed the process of image sensor configuration, Imatest recently integrated its software with the DevWare package from Aptina Imaging in an effort to optimize settings for the intended application. The integrated system allows images captured by DevWare to be automatically imported and analyzed by Imatest as sensor settings are changed, so the effects of various sensor settings can be monitored in real time. Similar efforts are underway to integrate other vendors’ software.
Norman Koren is founder/CTO and Randy Bockrathis CEO of Imatest, Boulder, CO, USA; www.imatest.com.