CONSUMER PRODUCTS: Test system visualizes user’s quality of experience
Whether they be mobile phones, portable global positioning systems, or large-screen displays, today’s display-based consumer products must perform in a manner acceptable to the end user. While acceptability levels are subjective from the customer’s perspective and may depend on factors such as the reaction time of the display, they may also be defined from an objective standpoint by the manufacturer in terms of a device’s bandwidth and memory.
While users may not be particularly concerned with the technical specifications of these devices, the so-called quality of experience (QoE) obtained by using them is critical. “In mobile devices in particular,” says Hans Kuosmanen, senior project manager at OptoFidelity (Tampere, Finland; www.optofidelity.com), “QoE is dependent on a number of factors that include the perceived video quality and the response time of the network.”
While the perceived video quality may depend on how the transmitted content is encoded and the network bandwidth, any network latency will also affect the user’s QoE. “In the past,” says Kuosmanen, “measuring the QoE of such devices was a manual process in which an operator would watch specific changes on a display and make reports based on the quality of the images and response time of the device.” Because of this, the test results were often inaccurate and subject to human error.
To overcome this, OptoFidelity has developed an automated display test system based around off-the-shelf components that allow objective benchmarking of such products to be performed in an automated fashion. One of the systems, known as the OptoFidelity AV100, can measure the perceived video quality from the display of mobile devices and return a mean opinion score (MOS) based upon the ITU-T J247 recommendation.
“The ITU-T J247 specification takes into account such parameters as frame rate and how blocky or blurred the image is, and, once measured, can be combined into a single QoE MOS. Since such parameters can be tested objectively, they can be analyzed by a vision system and provide a measurement of the user’s QoE with the device,” says Kuosmanen.
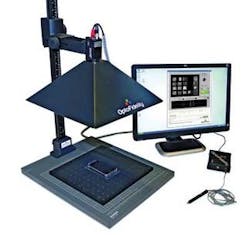
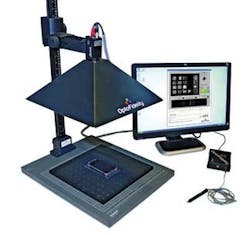
Another system called OptoFidelity WatchDog can measure latency and response times directly from the user interface of any product (see Fig. 1).
At NIWeek 2009, held in Austin, TX, OptoFidelity demonstrated the WatchDog system and showed how it could be used to analyze the performance of an Apple iTouch. “Depending on the refresh rate of the visual events to be analyzed, the speed of the camera must be at least twice this refresh rate,” says Kuosmanen. In the demonstrated WatchDog system, a CV-A33 Camera Link camera from JAI (Copenhagen, Denmark; www.jai.com) was used to digitize images at 120 frames/s into a PXI-1428 Camera Link frame grabber from National Instruments (NI; Austin, TX, USA; www.ni.com).
To accurately measure the response time of the iTouch display, it was necessary to precisely trigger any human interface with the display with the sequence of captured images. To accomplish this, OptoFidelity developed a pressure-sensitive device called OptoFinger for the user to interact with the display. In operation, signals from this pressure sensor were digitized using an external USB-6009 14-bit, 48 kS/s data acquisition module from NI. Digitized signals from OptoFinger were then transmitted over the USB interface to the system’s PXI-8106 embedded PXI controller.
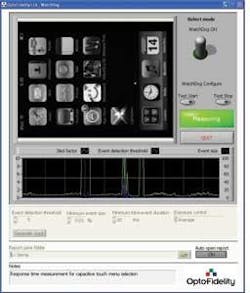
To visualize the refresh of the display while at the same time monitoring the interaction of the user with the display, OptoFidelity developed a user interface based on NI LabVIEW (see Fig. 2). After the system is initiated, images are time-stamped and streamed to disk in the embedded controller. As the user interacts with the display using OptoFinger, timed event data are simultaneously captured. Later, when images and data are reported, the user can then visualize the correlation between the speed of the interaction of the device and how fast the screen is refreshed.
“In this way,” says Kuosmanen, “the process of performing a QoE analysis on such devices is fully automated. Because the WatchDog software is written in LabVIEW, it is also portable to other NI devices, including an NI smart camera.” While this allows smart cameras to perform the same function, the limited resolution and speed of these devices may limit them in applications where high-resolution images must be captured at high-speed.


