No Famine of Ideas at NIWeek
Andrew Wilson, Editor
In August, I had the pleasure of attending NIWeek, National Instruments’ (NI) annual trade show and conference. As in years past there was plenty to see and do. Keynote presentations showed how the latest data acquisition, motion control, and imaging technologies were being incorporated into sophisticated products that included CT scanners, display test equipment, and machine-vision systems.
Even in a slow economy, more than 3000 engineers and scientists, the largest number of NIWeek attendees to date, attended discussions, alliance group meetings, tutorials, and the trade show itself. Of course, many of the presentations were not devoted solely to machine vision and image processing. The show managed to incorporate a blend of data acquisition, motion control, high-speed test, and wireless developments firmly into the mix. Indeed, most of the hardware introductions at this year’s show addressed these areas (see “Hardware introductions at a glance,” below).
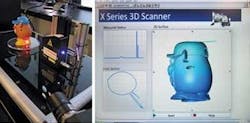
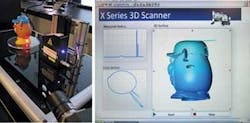
On the first day of the show, for example, Daniel Domene, software group manager and Sam Freed, product manager of the NI data acquisition group, used—of all things—a Mr. Potato Head mounted on a rotating platform to show the capabilities of NI X Series data acquisition products. By mounting a Microtrak II laser triangulation system from MTI Instruments on a vertical platform, a series of horizontal scans was captured at every 360° as the toy rotated.
To control the laser range finder, linear actuator, and rotary encoder used in the system, Domene and Freed used a $599 NI X Series PCI Express board. After reflected laser data were digitized, they were stored in the PC memory and dynamically reconstructed to generate a 3-D scan of Mr. Potato Head (see Fig. 1). Once stored as a 3-D model, the image was then manipulated in real time using NI LabVIEW software. Those wishing to view a video of the system in action can do so by visiting http://zone.ni.com/wv/app/doc/p/id/wv-1681/.
null
null
Algorithm advances
Developers of machine-vision and image-processing systems were not to be disappointed, however. At the Vision Summit, many presentations highlighted both the latest image-processing algorithms and how NI’s vision products were being deployed in machine-vision systems.
One of the highlights of these presentations was that by Rob Giesen of the NI Vision Group, who explained the advances his company had made in both color-classification and pattern-matching algorithms. Giesen described the company’s color-classification algorithm that identifies an unknown color sample of a region in the image by comparing the region’s color feature to a set of features that conceptually represent classes of known samples.
By first extracting color features from a color image and transforming these color values to HSI color space, the algorithm generates a color feature that comprises a histogram of hue, saturation, and intensity (HSI) values. This color feature can then be stored either as a high-resolution feature using the entire HSI histogram or as medium- and low-resolution versions that use reduced samples of HS histogram values.
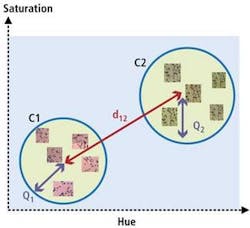
To perform color classification, the HS values of individual colors will fall within discrete color spaces (see Fig. 2). In this manner, known color classes can be plotted and the class distance and interclass variation between them can be computed. Thus, for a color classifier to operate correctly, the interclass variation between different color classes must be much less than the class distances between individual colors. By implementing nearest neighbor (NN), k-nearest neighbors algorithm (k-NN), and mean distance classifiers, the system developer can chose a variety of ways to tailor this classification for specific color-analysis applications.
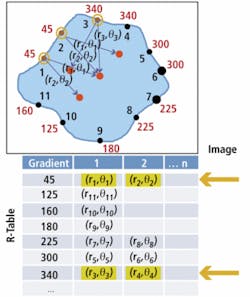
After discussing these benefits, Giesen described advances the company had also made in geometric pattern matching (GPM), introducing the audience to an edge-based pattern matching tool based on the Hough transform. In this algorithm, edge points found in the template image are matched to edge points in the target image using a generalized Hough transform.
After specifying an arbitrary reference point in the feature within the template image, the distance and angle of normal lines drawn from the boundary to this reference point are computed. This look-up (or R-Table) is then used to define the feature within the image. By then computing the distance and direction pairs within the target image feature and matching these two feature tables, GPM can be performed (see Fig. 3).
null
Digitizer boards
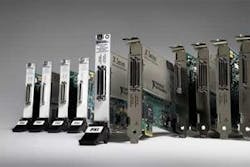
On the show floor, exhibitors showed their latest products that complemented the range of offerings from NI. To support the NI FlexRIO board, both NI and Adsys Controls showed two Camera Link adapter boards. While both NI and Adsys boards support Base, Medium, and Full configurations, Adsys Prolight CLG-1 adds support for GigE Vision-based cameras (see “Third parties add vision modules to PXI systems,” below).
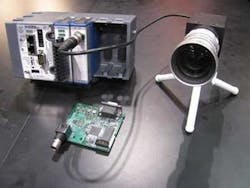
However, it was not just the NI FlexRIO product that was gaining support from third-party vendors. At the MoviMED booth, Markus Tarin, president and CEO, showed the company’s AF 1501 analog frame grabber, which the company had developed to operate with the NI CompactRIO programmable automation controller (see Fig. 4).
As the board digitizes analog video directly with a 9-bit TI 5150 DAC from Texas Instruments, it can support any type of analog input. Once digitized, this analog video is buffered by 512k × 8-bit SRAM, deinterlaced and transferred over the 10-MHz backplane of the CompactRIO system. During NIWeek, MoviMED showed the AF 1501 operating in a chassis along with a CompactRIO-9022 host controller, an NI-9474 digital I/O board, and a TM-7CN camera from JAI.
According to Tarin, the 10-MHz speed of the system backplane does limit the data transfer speed of images. However, these can be reduced by on-board sub-sampling to 1/4 VGA resolution to obtain a 30 frames/s data rate. Alternatively, full VGA images can be transferred at a slower rate. To support Camera Link on the CompactRIO system, MoviMED is also planning a Camera Link module for possible introduction early next year.
Despite the lack of major hardware product introductions, NIWeek remains an important conference and trade show for those involved with machine vision and image processing. At next year’s show, it will be especially interesting to see whether NI will further extend its smart camera family and current PXI Camera Link boards by adding on-board programmable FPGA support for machine vision.
Hardware introductions at a glance
High-speed digitizer—Developed in partnership with Tektronix, NI’s latest PXI Express digitizer features a 3-GHz bandwidth, sample rates of 10 GS/s, and data throughput of 600 Mbytes/s. The digitizer runs LabVIEW, LabWindows/CVI ANSI C software development environment, and Microsoft Visual Studio .NET.
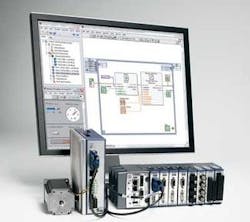
Motion controllers—NI C Series modules expand the CompactRIO range to servo and stepper drives from NI and third-party vendors. The NI 9512 module connects to stepper drives and motors, while the NI 9514 and NI 9516 modules feature single- and dual-encoder feedback, respectively, and interface with servo drives and motors. To program motion profiles with a high-level, function block API based on the Motion Control Library defined by PLCopen, NI LabVIEW-based SoftMotion includes function blocks for straight line, arc, and contoured move types and function blocks for electronic gearing and camming. The module also features trajectory generation, spline interpolation, position and velocity control, and encoder implementation.
PXI Express chassis and controllers—NI PXIe-1073 chassis features five PXI Express hybrid slots that accept both PXI and PXI Express modules, provides 250 Mbytes/s of bandwidth and an integrated MXI Express controller with PCI Express host controller card. PXIe-8102/01 embedded controllers couple the PC and chassis in a self-contained system. While the NI PXIe-8102 features a dual-core 1.9-GHz Intel Celeron T3100, the NI PXIe-8101 uses a single-core 2.0-GHz Intel Celeron 575. Integrating these controllers into a PXI Express chassis, such as the NI PXIe-1062Q or PXIe-1082, provides a system that delivers up to 1 Gbyte/s of total system bandwidth and up to 250 Gbytes/s of single-slot bandwidth.
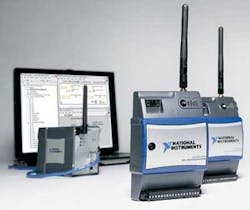
Wireless sensor networks (WSN)—Powered by four AA batteries, the NI WSN-3202 four-channel, ±10-V analog input node and NI WSN-3212 four-channel, 24-bit thermocouple node have four digital I/O channels that can be configured for input, sinking output, or sourcing output. The wireless devices include NI-WSN software, which connects the NI wireless devices to LabVIEW software running on Microsoft Windows or a LabVIEW real-time host controller. NI-WSN software is based on the IEEE 802.15.4 standard and gathers data from the distributed nodes.
Multifunction data acquisition—Sixteen X Series data acquisition devices provide analog I/O, digital I/O, onboard counters, and multidevice synchronization. The X Series includes up to 32 analog inputs, four analog outputs, 48 digital I/O lines, and four counters, ranging from 250 kS/s multiplexed to 2 MS/s simultaneous sampling analog inputs. The X Series devices use a native PCI Express interface to provide 250 Mbytes/s of PCI Express bandwidth.
Visual perception holds key to image analysis
In his keynote address at the Vision Summit, held at NIWeek in August 2009, Gregory Francis, professor of psychological sciences at Purdue University (West Lafayette, IN, USA; www.purdue.edu) spoke of how human visual perception could be used to develop more sophisticated image-analysis algorithms. Using a number of optical illusions, Francis showed how by studying human perception, software engineers could better develop algorithms to resolve features within images.
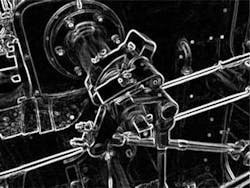
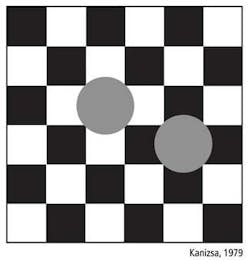
“Usually,” he said, “image-processing algorithms such as the Canny edge or Sobel operators are used to find features such as edges” (see Fig. 1). While these operators are useful, they may find edges that are not related to a specific object and, unlike the human perceptual system, cannot interpret the image data to account for factors such as occluded objects (see Fig. 2).
null
“In essence,” says Francis, “there are two types of perception: modal and amodal perception. While modal perception relates to the visual awareness of the color, shape, and brightness of a surface, amodal perception is concerned with the visual awareness of the arrangement of information within the image. More aptly,” he says, “amodal perception can be referred to as knowing without seeing.”
However, this amodal perception is not related to human knowledge and experience. As can be seen from Fig. 2, though statistical inference implies the occluded checks should be different from their neighbors they appear amodally to be the same color as their neighbors. In the same way that parts of the engine pipe are occluded in Fig. 1, such assumptions about what a color may be often arise when objects within images are occluded.
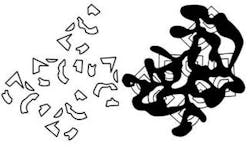
For traditional image-processing operators such as the Canny detector or Sobel filter, this often presents a problem and therefore edges often are difficult to identify. “However,” says Francis, “such occlusion is not always bad for image detection.” In work carried out in 1981, Albert Bregman, now at McGill University (Montreal, QC, Canada; www.mcgill.ca), showed how an occluded ink blot was used by the human visual system to aid recognition of fractured letters (see Fig. 3). By connecting the elements behind the ink blot, the “B” letters become easily discernable.
“This type of occlusion,” says Francis, “is not just an issue for certain types of scenes but is in fact an inherent part of the human visual system.” Before light is captured by the retina, it must pass through blood vessels that provide nutrients for the cells. The blood vessels cast shadows on perceived images that are always present.
“Indeed,” says Francis, “occlusion is a fundamental part of perception, and the visual system removes these retinal vein shadows.” Since static elements such as vein shadows do not move, they gradually fade away within the visual system and the disappearing parts are replaced by a modal representation of another color and brightness, usually from surrounding input data.
“The human visual system,” says Francis “is composed of both a feature and boundary system.” Whereas the feature system represents and codes surface properties such as brightness and color, the boundary system separates one element from another in a way that the boundaries are not exactly “seen.” In the engine block, for example, the occluded regions of pipes may be perceived but they are not really present.
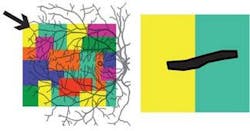
The different parts of the visual system complement each other through complex interactions. Retinal vein shadows cover part of every image, but simply removing the edges of the shadows does not generate a corresponding modal perception of the occluded region. The boundary system connects broken contours to contain a spreading of color information within these newly defined “illusory” boundaries (see Fig. 4).
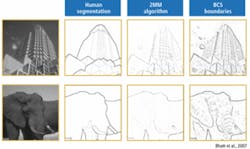
In his presentation at NIWeek, Francis showed how these concepts could be applied to image detection, comparing methods developed around human segmentation, an information theory-based algorithm known as the second moment matrix (2MM), and those based on a boundary contour system (BCS). “As can be seen,” he says, “when implemented properly, the human segmentation finds boundaries within images in a similar way to the human visual system” (see Fig. 5).
null
Company Info
Adsys Controls, Irvine, CA, USA
www.adsyscontrols.com
JAI, Copenhagen, Denmark
www.jai.com
MoviMED, Irvine, CA, USA
www.movimed.com
MTI Instruments, Albany, NY, USA
www.mtiinstruments.com
National Instruments
Austin, TX, USA
www.ni.com
Tektronix, Beaverton, OR, USA
www.tek.com
Texas Instruments
Dallas, TX, USA
www.ti.com
