Andrew Wilson, Editor, [email protected]
As a senior research engineer with the Industrial Imaging Group of Procter and Gamble (Cincinnati, OH, USA; www.pg.com), Stephen Varga is responsible for overseeing the specification and deployment of many of the company’s machine-vision systems. “When designing these systems,” says Varga, “engineers can use image-manipulation or simulation techniques to speed development and validate system conditions to ensure that more robust applications are deployed.”
Speaking at this year’s NIWeek in Austin, TX, USA, Varga prefaced his presentation by stressing the importance of using the correct lighting and optics to obtain a good image. “In machine vision,” Varga says “a good image is one where features to be inspected are clearly separated.”
To do this, lighting and optics should both minimize the system’s sensitivity to features that are irrelevant and any variations in them. “While direct light may highlight how shiny an object is, low-angle lighting will show surface characteristics. Backlighting is also often used to intensify attributes of the object’s shape.”
After the correct lighting is chosen, designers must compensate for possible product variations or product presentation variations that may occur in manufacturing. “If these differences can be anticipated to some extent,” says Varga, “then image manipulation or simulation can prove useful. In many cases, these can be achieved in real time using filters or by generating sample sets from a limited number of given images using software such as Photoshop, LabView, or custom software.”
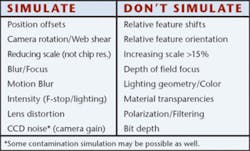
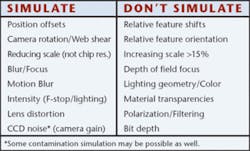
At Procter and Gamble, Varga has developed a number of Virtual Instruments with LabView from National Instruments (Austin, TX, USA; www.ni.com) that perform these functions. This software can simulate the effects of shear and motion blur, intensity changes, rotation, focus blur, and camera noise (see box).
“After the tests have been performed, the system designer can better judge when a specific machine-vision algorithm is likely to fail,” says Varga. However, it is still necessary to determine the resolution, precision, and accuracy of the system.
“Although the sharpness of an imaging system is characterized by the modulation transfer function (MTF) or spatial frequency response, it can be confusing in practical applications because not all companies report the MTF using the same methods. A good rule of thumb is that for rigid objects under controlled lighting, an error of one pixel is expected, while for flexible objects, an error of two or three pixels is typical.”
To ensure that this is achieved over the entire field of view (FOV) of the imaging system, Varga suggests that calibration targets be checked in all areas of the FOV, since lens distortion may scale the results differently from the sides to the center of the image. Keeping a fixed-position reference in view during system operation is also useful in confirming no camera movement has taken place.
In performing measurements of known objects, it may also be important to determine whether the software tools being used are performing as expected. By sampling typical variations of a part, for example, and determining the angle, straightness, and signal-to-noise ratio of features and characteristics within the image, it is possible to determine the mean and standard deviation of these measurement characteristics.
“When new parts are introduced to the system, they will generate a new set of mean and standard-deviation results,” Varga says. “When these are compared with the existing measurements, the resulting sigma value provides a measure of how closely these new samples match the trained data, providing the system’s developer with a measure of system confidence.
“The means and standard deviations observed are those of the characteristics of the measurement tools themselves, not just the measurement results of the inspected features. For example, if the inspection is the width of a part, it’s expected that the width will vary between good and bad parts. However, one can still expect to measure parts with straight edges and similar contrast. If the straightness or contrast of the edge found is suddenly different, then there may be a problem with the measurement result because the software tool is probably measuring an unanticipated feature. The sigma change is then a measure of how confident one can be in the final measurement.
“This method is useful because software tools are selected based on assumptions of the features to be measured. When those characteristics change, the software notifies the system. Using pattern-matching scores can also achieve this, but it takes more processing time and can be more difficult to set up since the pattern tools may fail themselves,” Varga says.
“Typically 4 σ to 8 σ is used as a warning,” Varga says, “although it is not usually a good idea to hard code these limits.” Although the signal-to-noise ratio does provide a measure of how distinct the signal is, it is important to properly balance both the signal-to-noise ratio and the signal-to-threshold ratio in a system. For example, a system with a good signal-to-noise ratio but a poor signal-to-threshold ratio may result in a system where image edges are not easily detectable.
