Color-matching systems test visual quality

By Jessica Gehlhar and Glenn Archer
Color is a human perception based on a number of factors, and it is one of the most important visual cues we have for inspecting objects. For example, to make sure a consumer product elicits the desired color perception from the purchaser or user, manufacturers must test it under standardized conditions with a system that mimics human vision.
There are many ways to use color in machine vision, but one application is ensuring that every part of a product visually matches and that products displayed next to one another match. Mis-colored packaging, for example, may cause customers to think a product is old or defective in comparison to the surrounding correctly colored packages. These types of perceptions can be predicted, quantified, and corrected by carefully installing a visual color-matching system.
The goal of a visual color-matching system should not be confused with other color-measurement systems such as a common ‘color’ system for color sorting. Producing crayons, for example, may use visual color matching or color sorting at different times. The crayon manufacturer may want to guarantee that the red crayon in each color-assorted box will look identical in every box. This application needs a visual color-matching system to predict whether two red crayons will look the same to a customer. The manufacturer may also want to make sure that there is only one red crayon in each box. This can be done with a simple color-sorting system.
Color is visual perception in which the viewer integrates an object’s spectral properties with its illumination and viewing environment. Cameras do not see color because they only detect levels of integrated spectral information. This information becomes a specific color when a human observer views it under particular conditions. Since every person sees and describes color differently, we need to use a standard model of a human observer to automate color inspection.
Such a model is necessary for color-matching applications, where we need to predict how a product will look to the final customer. Color-sorting applications do not require a human model because they simply need to sort objects with obvious color or spectral differences.
Right conditions
Visual color-matching systems are often the least understood of test systems. They must judge color in the same way that humans do and simultaneously be very sensitive and rugged. The test conditions must model how two supposedly identical units will look next to one another under final viewing conditions. Will they appear identical, or will customers perceive a difference?
One way to set up this test is the “golden-reference” strategy. Start by choosing an ideal (or golden) unit from the pilot production runs. This unit should be as close to perfect as possible. That is, its visual properties should be what every other product will match. Every production unit should then visually match the golden-reference unit.
Using relative color analysis, the inspection system will measure visual color differences between each unit under test (UUT) and the golden-reference unit. To provide consistent results, test conditions such as light sources, object characteristics, color models, detecting devices, and environmental conditions must not vary between tests.
Lighting
Lighting and how it interacts with UUTs should be the first consideration. Light-source intensity stability, spectral characteristics, and geometry all affect color-difference measurements. The lighting should have intensity stability, meaning the total amount of light emitted from the source should be constant over time.
Ambient temperatures can have a considerable effect on intensity stability, and even the slightest variation in ambient temperature can dramatically change light-source characteristics. For example, some fluorescent lights change intensity 5% to 10% when the ambient temperature shifts as little as 10%.
The source’s flicker rate can affect measurement stability, as well. A fluorescent lamp’s output, for example, changes rapidly in time with ac power cycles. If the power-line frequency is too low, the intensity will vary from one color measurement to the next and can play havoc with tests using fast acquisition times on an assembly line.
The source’s spectral characteristics can cause a decided difference in measurement precision. The light source needs to include emission at every wavelength within the visible range (380 to 720 nm). If a UUT is blue and the light source does not have sufficient blue emission, realistic results are impossible. Using continuous-spectrum “white” lights in color testing systems avoids such problems.
Since the final viewing light may differ from the test light, the test should provide color data independent of the test light. Canceling the test light (“zeroing” the system) provides relative spectral and colorimetric results. Zeroing the system also accounts for different color sensitivities between detectors.

White balancing requires a white reflectance standard, which has a known amount of reflection at each wavelength across the visible spectrum (see Fig. 1). White reflectance standards can be made from Spectrolan, which is a durable, washable, and often US National Institute of Standards & Technology (NIST) traceable material, but fairly expensive. It is much less expensive to perform white balancing with materials such as Kodak’s 90% white reflectance test card. Acceptable results can also be obtained with high-quality white copy paper, but the results are not, of course, NIST-traceable. Most vision cameras offer some level of white balancing capability. While white balancing can improve the results from a good, stable white source, it will not help a light with stability problems.

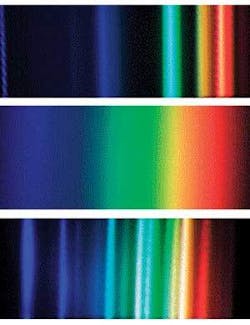
One lighting issue that manual white balancing cannot correct is metamerism, where two UUTs look the same under one light source but look different under another light source (see Fig. 2). Metamerism is common when light sources include line spectra (sharp intensity peaks at specific wavelengths). Many common light sources, such as fluorescent and metal halide lamps, emit line spectra in addition to or instead of continuous emission (see Fig. 3). Because human visual systems cannot distinguish detailed wavelength information, two UUTs can have different spectral curves but still look the same color. When illuminated by a different light source, their spectral differences may be emphasized, causing the differences to be noticeable by a consumer. Since many devices such as cameras do not detect detailed spectral information, they will be affected by metamerism.
Geometry is the final lighting factor to consider. Geometry describes the alignment between the source, UUT, and detector. The optimum geometry will depend on the physical characteristics of the UUT. Objects can modify the illumination field in five basic ways: reflection, transmission, scattering, absorption, and emission. Objects usually exhibit a combination of these effects. The International Commission on Illumination (CIE) provides recommended lighting geometries for various surfaces through their Web site at www.cie.co.at/cie.
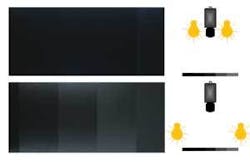
Highly glossy surfaces, for example, have high reflectivity. Placing the source at a low angle to the surface and adding a diffuser to reduce specular reflections will enable detection of small visual differences (see Fig. 4). Using an integrating sphere is another option for inspecting such flat, shiny material. The color difference measurements will vary whether specular reflections are included or excluded from the system.
Deeply textured products require lighting that is even and sufficiently diffuse to provide consistent measurements while highlighting texture differences that affect color appearance.
Right standards
How a color is described makes a big difference in the ability to gauge how a consumer will perceive it. Some standard color spaces, such as the RGB description, are good for specifying how a camera should detect a color but provide no insight into how a human will perceive it. Other standards, such as CIELab, quantify the color differences that humans perceive.
The XYZ color space, for example, was designed to describe a color based on a standard human observer. While XYZ values can tell whether one UUT matches the golden reference unit by showing whether the XYZ values coincide, if the values differ, XYZ values provide no information on how the colors differ or whether the difference will be visually noticeable.
CIELab color values are ideal for visual matching systems because they represent color the same way humans perceive it. This standard uses so-called opponent theory, which relies on the fact that an object cannot look red and green at the same time, nor can it look yellow and blue at the same time. In the CIElab system three values (L*, a* and b*) quantify a color. The first (L*) quantifies perceived brightness (that is, gray level). The second (a*) represents how red or green the object looks. Positive a* values represent reddish colors and negative values indicate greenish ones. The third parameter (b*) indicates yellowish versus bluish colors. Positive b* indicates yellow and negative b* indicates blue.
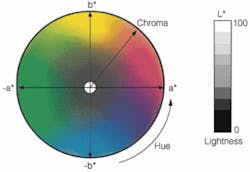
The CIELab color space is perceptually uniform, so that equal differences in the color space (ΔE) represent equal human-perceived color differences (see Fig. 5). If the product looks too bluish, fixing the problem becomes very easy. It is possible to calculate CIELab values using measurements from spectrometers, colorimeters, and color vision cameras.
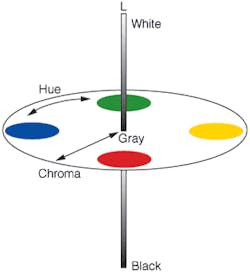
HCL color values describe color in the most intuitive way. A given color appears as a point located in a three-dimensional color space defined by hue, chroma, and lightness (HCL) axes. Hue describes how red, green, blue, or yellow the color appears. Chroma represents the color’s departure from gray, which people perceive as saturation or vividness. Lightness describes how dark or light an object is. The lightness scale runs from black to white with gray in the middle. Hue can be calculated from a* and b* values. Lightness is the same in either scale. Chroma can be calculated from a* and b* values (see Fig. 6).
Right Measurements
Spectrometers provide the most complete color measurements, quantifying the relative spectral properties of the UUT in sufficient detail to predict metamerism. Most off-the-shelf spectrometers look at a small area on the UUT, while others require integrated measurements over a larger area. You may need to design custom lighting and optical systems to illuminate and measure such UUTs.
Colorimeters measure color as a set of XYZ values directly. Computerized units can calculate CIELab values directly from these measurements. Using a colorimeter reduces data collection and calculation relative to a spectrometer. This typically leads to faster measurements. Colorimeter measurements require the same attention to the same lighting and data collection considerations as spectrometers.
Color cameras make RGB measurements directly. Computerized systems can estimate CIELab values from the RGB measurements. What cameras provide that the other instruments cannot is spatial information. Cameras can measure colors of different parts of the UUT simultaneously. They can also perform additional tasks-such as optical character recognition, particle analysis, and gauging-while collecting colorimetric information.
Two cameras from the same manufacturer may differ in spectral response by up to 10%. When properly calibrated and white balanced, however, color difference measurements can be remarkably consistent.
It is important to test a vision-based color-measuring system in an environment similar to that in which it will be used. Detectors tend to change sensitivity and noise levels with shifts in ambient temperature. Changes in temperature may require calibrating the system more often or installing a thermoelectric cooler to prevent inconsistent measurements. Some manufacturers of three-chip cameras recommend operating the instruments at below 40º C to reduce noise.
Each detecting device, whether it is a spectrometer, colorimeter, or camera, has its own relation to noise and changes in temperature. Again, pay close attention to the specifications from the manufacturer regarding temperature changes and their effect on the detector.
After setting up the inspection system, it must be tested to ensure that it can detect the smallest color differences of interest. The best method is to have a batch of visually acceptable UUTs and a batch of visually unacceptable ones to test against the reference unit. If the system can reliably distinguish between good and bad UUTs, it will provide good test results.
Most engineers set their measurement tolerance levels empirically. The correct tolerance bands relate real-world observations to the test data. The CIELab system does a good job of predicting color differences, but the final calculated color measurements need to be verified by field experience.
Overall, it is important to spend time up front getting to know the target UUT, setting up ideal lighting, and making sure the tolerances provide an efficient system.
Jessica Gehlhar is applications engineer at Edmund Optics, Barrington, NJ, USA; www.edmundoptics.com; Glenn Archer is director of business development at Epic Vision Solutions, St. Louis, MO, USA; www.epicvisionsolutions.com.
The beginning of a visual matching system
One of the most difficult items to measure for color is textured, glossy, large, mottled color, fluorescent, and filled with metallic flakes-it’s bubble wrap. It has deep texture, is made from shiny plastic, comes in large rolls, and the number of plastic layers (and therefore overall color) varies throughout the roll. These four characteristics can make it difficult to get a quantitative number to represent the overall color of the bubble wrap.
Many off-the shelf spectrometers and colorimeters have very small instrumental errors, meaning they can measure very small color differences, but prove useless for the bubble-wrap measurements because of the deep texture and varying layers of material. The ΔE values (overall color difference) vary largely depending on what area of the bubble wrap is measured. This means that the overall system tolerances are not tight, and the equipment is not able to consistently detect the different shades of color.
As a step toward developing a color-matching system for this application, a system was developed in a lab. The off-the-shelf devices were replaced with a large fiberoptic backlight with tungsten halogen illuminator, a FireWire camera from Basler (Ahrensburg, Germany; www.baslerweb.com), and a frame grabber from National Instruments (Austin, TX, USA; www.ni.com), which also provided the IMAQ for 1394 cameras and Vision Builder software. The lighting was chosen to provide even illumination over a large area of the bubble wrap. Any colorcast caused by the backlight was accounted for by white balancing. To integrate the overall color of each panel, the lens was slightly defocused, and multiple images were taken and averaged.
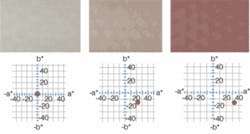
Red, green, and blue values from the camera were converted to L*a*b* values using the Vision Builder software, and ΔE values were calculated between each test measurement. When tested in the lab, the instrumental error was extremely small. Theoretically, a ΔE of 2.3 would represent a just noticeable difference between two colors and the system had a measurement error well under a ΔE of 1.0. The process for determining the instrumental error included taking many images of one sample piece of bubble and noting the variation in ΔE values between the sample piece and the standard piece. This was done for all of the acceptable and unacceptable colors to make sure the error was consistent (see figure)
To bring this system to the factory floor will require on-site testing. Despite precautions, the instrumental errors are usually higher on-site than in the laboratory. A light block placed over the system to block out ambient light from the factory and shadows from people walking by is always necessary. Changes in the ambient temperature can affect the brightness of the source and the sensitivity of the camera. The differences may vary enough so that the repeatability of the system is too low to meet the tolerances that are required. The ambient rise in temperature may be on the order of 20˚F from morning to mid-afternoon. This would cause the lighting intensity to change and the camera’s background noise to increase so that the calculated L*a*b* values would also change.
Depending on the camera and setup, values for L* could shift 5% to 8%, and values for b* could shift 10% to 22%. This can cause difficulty in monitoring a color precisely.Once the temperature is controlled, additional light diffusion or changing the geometry slightly may be necessary to get the desired instrumental errors.
To determine if the instrumental error is small enough, ΔE values should be measured between the standard and an unacceptable part to make sure the measured ΔE differences are larger than the instrumental error in ΔE. If the unacceptable part is always failed and acceptable parts are always passed, the instrumental error is small enough and the tolerances are reasonable. From this point, the system is ready for final design and integration. -J.G.