Understanding color machine vision
From simple sorting to complex analysis of print, color vision systems can provide production verification if the proper controls are built into the system.
By Steven Prehn
Many color-verification systems match the color contained within images to a predefined color. Determining the extent of color control needed in the system depends upon the application and how the tools are applied. If a part simply needs to be verified as red and the system need not analyze the exact color composition, strict controls may not be needed. However, if a machine-vision system needs to ascertain that the red exactly matches a defined pantone color, the system may benefit from white-balancing and color calibration. Special attention should also be given to control even minor color shifts that are the result of aging lights, temperature, and ambient lighting conditions.
When designing a color vision system, the wavelengths contained in the light source, those reflected and absorbed by the surface of the part, and the frequency-response curve of the camera must be considered. Like the eye, a camera gathers light reflected (or transmitted) from objects. If light strikes a shiny surface and reflects into the camera, surface color information is lost. For this reason, color vision systems will often benefit from using diffuse or disparate light sources such as ring lights. Fortunately, several companies provide products that improve the robustness of color systems. Most often, color machine-vision systems should use cameras that provide automatic white balancing, and lights that provide a uniform distribution of intensity over the color spectrum.
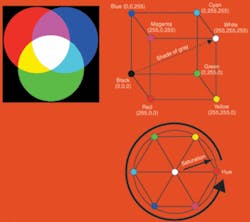
Like monochrome systems, color machine-vision systems operate effectively if they can easily detect the differences between good and bad parts. Choosing the correct color space is an important aspect of the system design, as it will enhance the separation distance applied to the colors. Pure white light is comprised of a spectrum of colored wavelengths of equal intensity. A typical 24-bit color camera separates images into individual red, blue, and green planes, each with 8 bits of depth using color filters. By mixing different R, G, and B values, nearly all visible colors can be created (see Fig. 1). This recombination is a result of the additive properties of primary colors.

Normal machine-vision tasks, such as gauging the critical dimensions of parts, inspecting the integrity of logos, and verifying proper assembly can be augmented by color tools. Although many of these applications do not benefit from color inspection, there are cases where working in color space provides benefits. PPT Vision, for example, has developed a color meter tool that can be trained by averaging the individual intensities of primary RGB colors in a sample region. Once trained, the programmer can set the amount of acceptable color variation allowing the system to render pass or fail judgments. aptúra has used this software to develop a color machine-vision system for the bottling industry to ensure the proper color cap is applied to the correct cartons of milk.
RGB to HSI
Identifying which aspect of the color is critical is also important. If a part must be inspected where changes in relative intensity are acceptable, converting RGB images into the hue, saturation, and intensity color space may be acceptable. HSI space is rendered by turning the RGB color cube on its black and white axis. Hue is then represented as the color on the outer rim of the circle, and saturation is the white component of the color as represented by the distance from the center of the circle. For example, the color pink has a red hue with a minimal saturation component. Intensity is the third dimension of this color space and runs toward the viewer (see Fig. 1).
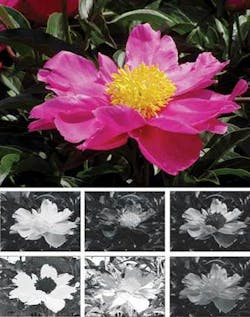
The concept of color separation is easily understood by examining the natural and subtle color variations found in nature. If an area on the petal of the flower is sampled in R, G, B space, for example, it may have a value of (200, 20, 130). However, very few pixels in the image have that exact value. For this reason, most color analysis tools use either histogram analysis of the trained region or allow users to specify the variation from a single point.
Although a person can discern the petals from the background, a vision system using only RGB Euclidian distances as a filter, cannot perform this task easily. By separating the image of the flower into individual H, S, I images, it becomes apparent that the petals remain fairly consistent in hue, but vary greatly in saturation (see Fig 2). When tolerances are set in the Hue and Saturation, the petals are now the only portion of the image that passes color filter thresholds.
My company was asked to design a vision system that uses this color-separation technique to verify the position, width, and height of adhesive glue lines on the top surfaces of polystyrene casting patterns. To do this, we designed an enclosure with banks of white LEDs reflected from white walls to create diffuse illumination. Insight 5400C cameras from Cognex were then white-balanced to equalize the red, blue, and green channels of the image.
The glue was evaluated in H, S, I space to determine the expected amount of color variation. This analysis showed that the hue of the glue would remain consistent and that the saturation component was a good indicator of the thickness of the glue. Tolerances were applied to compensate for the expected variation in the glue color; color distance tools were used to separate the glue pattern from the rest of the image. Once the pattern was extracted, newly glued foam castings were presented and compared to the master image. Differences between the two images indicated variations in the patterns that corresponded to gaps, bubbles, and voids even on the edges of the part.
CIE and delta E
The printing industry prefers to measure color and color differences in terms of internationally standardized color spaces based on human perception of color. One widely used color space is denoted L*a*b*, where the value of L* represents lightness, a* is the color value along a red-green axis, and b* is the color value along a yellow-blue axis. Since the appearance of color depends not only on the object itself, but also on the nature of the illumination, L*a*b* values are calculated based on a chosen standard illuminant. One appealing feature of the L*a*b* color space is that it is perceptually uniform, in the sense that two similar colors separated by a small distance ΔE [where (ΔE)2 = (ΔL*)2 + (Δa*)2 + (Δb*)2] appear to differ by the same degree no matter where in the space (for example, red region or green region) they are located.
Small hand-held colorimeters are available to measure mean L*a*b* values over a small (less than 1 sq cm) uniformly colored area. These devices can be highly accurate but are not typically suited for high-speed online measurements, since they are relatively slow and require contact with the measured surface. To inspect these patterns at high speed, Applied Vision Company (AVC) converts images into several different formats including ΔE and ΔLab, to monitor color stability. With careful attention to illumination stability, software image corrections and color calibration, AVC’s KromaKing family of color machine-vision systems can perform useful colorimetry online at high speeds. Though not as accurate as a colorimeter, such a system can reliably measure color differences of ΔE = 1 or 2, which is adequate for the quality control of most printed goods.
Using a show-and-go template-matching algorithm, flaws such as color shifts, print mis-registration, smears, and voids are found during system training. During this process, a number of different views of properly decorated cans are acquired and stored. Then when monitoring the production of such cans, each new image of the cans is compared with the stored image until a best match is found. Defects are found by comparing the current images to this best-match stored view.
Unlike their monochrome counterparts, color machine-vision systems can discern subtle variations in color. Determining the extent of color control needed in the system (and, therefore, the cost) depends upon the application. Analyzing what constitutes the difference between what is a good and bad color and designing a system that accentuates this difference is the key to success. From simple sorting to complex analysis of print, color vision systems can provide production verification if the proper controls are built into the system.
Steven Prehn is business manager, aptúra Machine Vision Solutions (Lansing, MI, USA; www.aptura.com).
Company Info
Applied Vision Company
Cuyahoga Falls, OH, USA
www.appliedvision.com
aptúra Machine Vision Solutions
Lansing, MI, USA
www.aptura.com
Cognex
Natick, MA, USA
www.cognex.com
PPT Vision
Minneapolis, MN, USA
www.pptvision.com