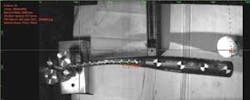
Vision improves bat performance
Sporting-goods manufacturer uses high-speed camera to improve the mechanical properties of baseball bats and hockey sticks.
By C. G. Masi, Contributing Editor
You might think that all there is to making a baseball bat is mounting a piece of wood in a lathe and cutting away everything that doesn’t look like a baseball bat. That might have been true in Babe Ruth’s time, but not anymore. “The bottom line for us, as for any sporting-goods manufacturer, is to make a product that is better performing than our competitors’ products,” says Al Murphy, manager of the test laboratory at Easton Sports.
Easton manufactures aluminum and composite bats for slow-pitch and fast-pitch softball and for baseball players from youth to adult baseball, and wood bats for professional baseball players. It also manufactures hockey sticks and skates. While sanctioning bodies, such as the Commissioner of Baseball and the National Hockey League, provide specifications for the equipment allowed, and most amateur organizations attempt to follow those rules, there is still considerable latitude for technical innovation.
The company has started using a motion-analysis system based on high-speed video to guide that technical innovation. “When a player is going to bat and make contact with the ball,” Murphy says, “the contact event is very fast--on the order of a thousandth of a second. It’s much too fast to see with the naked eye, so we use high-speed video to capture that event in slow motion.
“We can evaluate the performance in terms of how fast the ball leaves the bat. But performance is defined in much broader terms than speed. We can evaluate how the bat flexes and how it feels, depending on where you hit it with the ball. For hockey sticks, we can measure the duration of contact with the puck, speed of the puck coming off the stick, how the blade flexes, how the shaft flexes, the blade torque, and how fast the puck spins. Does it rebound directly off the blade, or does it kind of roll off the blade and off the tip?” he adds.
Consistency Rules
Product performance improvement relies on experimentation, which, in turn, depends on being able to set up repeatable experimental situations. That is, you have to be able to repeat the initial conditions, as well as the experimental action at will time after time. However, there is no way someone can consistently and repeatedly hit a ball or swing a hockey stick to duplicate the speed, angle of impact, and position of impact from one trial to the next.
So, Murphy uses robotic actors to fire a projectile (baseball or hockey puck) with a predetermined speed, direction, and rotation at a stationary bat or stick. Alternatively, he has other robots that swing a bat or stick at a stationary projectile. In all cases, the mechanical systems provide consistent, repeatable experimental conditions with triggers to coordinate video and data acquisition with the experimental action.
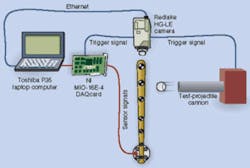
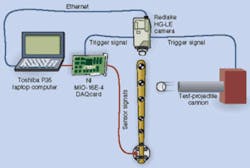
The system simultaneously acquires both high-rate video and streaming sensor measurements (see Fig. 1). To acquire video, Murphy uses a Redlake HG-LE mid-range, high-G, high-speed motion camera capable of 1000 frames/s at full resolution and up to 100,000 frames/s at reduced resolution. Full resolution on the camera’s CMOS sensor is 752 × 1128 pixels. This model is available in both color and monochrome, but Murphy prefers the monochrome unit for his work. “Color cameras require a lot more light,” he points out, “and the video files are about four times as large. And, color doesn’t really have any benefit for us.”
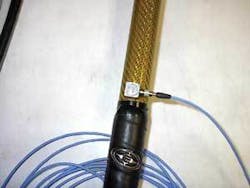
Typical sensors used are accelerometers attached to the equipment under test, force transducers, and strain gauges (see Fig. 2). Accelerometers provide information about impact, changes in motion, and vibrations. Strain gauges signal deformations of the bat or stick in response to stresses transmitted through the material, and force transducers measure applied loads. These signals go through a National Instruments (NI) SCB-68 terminal board to a NI PCI MIO-16E-4 plug-in data acquisition (DAQ) card or a NI PCMCIA DacqCard 6062E in the laptop.
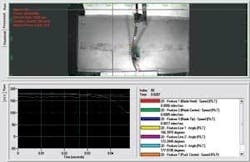
The camera has on-board intelligence to preprocess the video and send it to the system’s host computer via Ethernet. Depending on the experimental setup, two computers are available to coordinate the system: a Pentium III desktop computer and a Toshiba P35 laptop for more portability. The laptop runs Xcitex ProAnalyst motion-analysis software. The software zeros in on targets attached to specific points or features on the bat or stick and on the projectile. The software tracks the positions of these targets’ centers, as well as the angular orientation of a sequence of targets through the motion, calculating significant parameters, such as distance, deformation angles, and puck or ball speeds, as functions of time (see Fig. 3). ProAnalyst also can track featureless objects in one dimension. Along with the tracking capabilities, ProAnalyst provides for annotations on the video image and descriptive notes used to document the test and events in the video on a report that can be generated in HTML or PowerPoint or can be printed directly to a printer.
“I get a feel from the design people what it is that they’re looking for in the video,” says Murphy. “When I play back the video, I can track several points on a bat or on a hockey stick, looking for what it is that they’re looking for. Many times, I’ll see something during analysis that no one anticipated.
“Actually the software makes the measurements for me. For example, I can take three targets and have the software measure the angle they form in every video frame, then track how the angle changes as the event takes place. For a bat, it tells how the handle flexes. If you hit a bat on the sweet spot, the handle hardly flexes at all. But if you hit it significantly off the sweet spot, it can flex quite a bit.”
Coordinated Measurements
The system has to coordinate three activities: producing the impact, capturing the impact on video, and acquiring simultaneous measurements from sensors. The robot producing the impact initiates the procedure. The camera and data-acquisition system both free run, temporarily holding data as the information streams by in a buffer. When the robot initiates the action, it also sends out a trigger signal to the camera. When the signal arrives, the camera stores a preprogrammed number of pretrigger and/or post-trigger frames in the camera’s memory and simultaneously triggers the DAQ card to do the same. The buffers in the camera and NI LabView data-acquisition software allow the system to provide a significant amount of pretrigger/post-trigger data.
Murphy typically runs the camera at 2000-5000 frames/s and the DAQ card at a multiple of that. For example, he might run the camera at 3000 frames/s and the DAQ card at 30,000 samples per second. This, along with careful triggering, ensures that there is a sequence of DAQ measurements acquired simultaneously with each video frame.
Pro Analyst can export all of these data into an Excel spreadsheet, allowing Murphy to perform postanalysis there. If he wants to calculate accelerations or spins, for example, he can do it in Excel, then perform statistical or other calculations on the results. The result is new knowledge about how Easton products behave in use. For example, the company has found that when somebody uses a hockey stick to hit a slap shot, the stick usually doesn’t hit the puck only once. It hits the puck, then bounces off, then catches back up and hits it again. That double strike takes efficiency away from the slap shot. What they really want is for the blade to catch the puck and shoot it off.
Seeing the high-speed video along with quantitative motion analysis allows Easton designers to optimize the stick’s performance. They have achieved similar results with baseball bats, finding differences between the bat’s bending modes that transfer more energy down the handle to “sting” the batters hands when the ball hits the end, rather than the “sweet spot” (see Fig. 4)
Mike Snow, product-development engineer for hockey at Easton Sports, says, “Before we had the motion-analysis program, everyone in test, R&D, and marketing had their own perception of what variables make a good-performing hockey stick. With the motion-analysis system, all our teams are on the same page.
“The system’s key feature is showing the action of the stick in reference to tracking points positioned on the blade and shaft. By following these points through a slap shot, it is easy to see the amount of torque and flex in the shaft along with the action of the blade as it launches the puck. Seeing the relationship of the torque and flexing of the stick makes us better able to make adjustments to the internal design to maximize the playability or speed of the puck coming of the blade.”
Company Info
Easton Sports
Van Nuys, CA, USA
www.eastonsports.com
National Instruments
Austin, TX, USA
www.ni.com
Redlake
San Diego, CA, USA
www.redlake.com
Xcitex
Cambridge, MA, USA
www.xcitex.com
