Surveillance system integrates visualization
Distributed, smart-camera-based surveillance system captures events in real time in an integrated, georeferenced 3-D model.
By Sven Fleck
Surveillance systems based on distributed camera networks are emerging today as demand for enhanced safety has increased. A variety of areas are covered by such systems, for example, monitoring of power plants, shopping malls, hotels, museums, borders, airports, railroad stations, and parking garages. These installations often have several cameras that are widespread and hard to monitor.
In typical CCTV surveillance systems, the live video streams of potentially hundreds of cameras are centrally recorded and displayed on a huge monitor wall. Security personnel then have to analyze the streams and detect and respond to all situations as they see them. For example, in a typical Las Vegas casino, approximately 2000 cameras are installed. To track a suspect, the person must be followed visually by a specific camera. When the person leaves one camera’s view, there must be a switch to the next appropriate camera to keep up tracking.
Moreover, suspicious activities have to be detected visually by security personnel. Because of the quantity of raw video data and raw, counterintuitive visualization, these systems must deal with the fatigue of the security personnel to perform the necessary tracking and activity-recognition tasks reliably. One military study indicates that after approximately 22 minutes, an operator will miss up to 95% of scene activity. Privacy concerns and personnel costs are other major issues. A solution that can perform video analysis in an automated way, 24/7, is therefore essential. Moreover, an intuitive and integrated display with only the relevant information is needed, as well.
SMARTSURV SYSTEM
My colleagues and I at SmartSurv, a spinoff of the University of Tübingen, have developed the SmartSurv system-a fully distributed, smart-sensor-based surveillance system that reflects events in real time in an integrated, georeferenced 3-D model independent of camera views. It includes a plug-and-play style of adding new camera nodes to the network, distributed tracking, person handover, activity recognition, and integration of all camera results in one model.
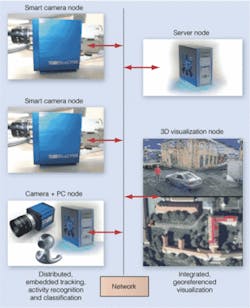
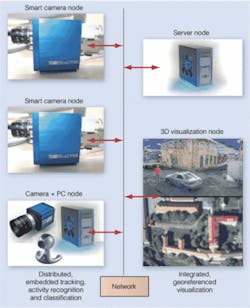
The system comprises the SmartTrack Camera Network-a distributed network of smart cameras capable of tracking in real time; SmartViz Visualization System-a system capable of visualization within a consistent, integrated, and georeferenced model that is available ubiquitously; and Server Node-a node that collects all data from the camera network and provides the interface to each visualization node. The results of the surveillance system are permanently updated on a password-protected Web server that can be accessed by multiple users. At the same time the server node includes a database-enabled storage solution (see Fig. 1).
The SmartTrack network of smart camera nodes is capable of video analysis in real time; only the results are transmitted on a higher level of abstraction. Each camera node is implemented by an mvBlueCOUGAR or mvBlueLYNX intelligent camera from Matrix Vision. Within existing installations without smart cameras, the video feed of any source, such as IP camera, industrial camera, webcam, or analog cameras with frame grabber, together with a PC, can also be used to form such a camera node.
SMART-CAMERA APPROACH
Each smart camera from Matrix Vision consists of a CCD or CMOS sensor, a Xilinx FPGA for low-level computations, a PowerPC processor for main computations, and an Ethernet networking interface. Both the mvBlueCOUGAR and the mvBlueLYNX 600 series perform main computations on a 400-MHz Motorola MPC 8245 PowerPC with MMU and FPU running embedded Linux.
The camera further comprises 64 Mbytes SDRAM (64 bit, 133 MHz), 32 Mbytes NAND-FLASH (4 Mbytes Linux system files, about 40 Mbytes compressed user file system), and 4 Mbytes NOR-FLASH (boot loader, kernel, safe boot system, and system-configuration parameters). The smart camera communicates via a 100-Mbit/s Ethernet (GigE in case of MvBlueCOUGAR) connection, which is used for field upgradeability, parameterization and self-diagnosis of the system, and transmission of the video analysis results (positions of the targets currently tracked) during runtime.
SmartSurv’s philosophy, “what algorithmically belongs to the camera is also physically performed in the camera,” is implemented in this system. Various benefits result from this. As the entire real-time video analysis is embedded inside each smart camera node, the video analysis can work on the raw, uncompressed, and thus artifact-free sensor data and transmit only the results, which require very limited bandwidth, making the use of Ethernet possible. The possible number of cameras could reach into the thousands.
Centralized solutions based on current IP cameras instead have to live with lossy compression to comply with inexpensive Ethernet network installations. Unfortunately, this somewhat degrades the applicability of automated video analysis, which has to be taken out by a central server installation for all cameras at once. This also limits the flexibility in scaling of the system, as both the network bandwidth for video transmission and the server installation become hard bottlenecks very quickly.
However, within SmartSurv, no centralized low-level computation of each camera’s data is necessary. A centralized server can instead concentrate on higher-level integration algorithms using all smart camera outputs as the basis. Moreover, by using smart cameras, the raw video stream does not need to comply with the camera’s output bandwidth, so sensors with higher spatial or temporal resolutions can be used.
EMBEDDED VIDEO ANALYSIS
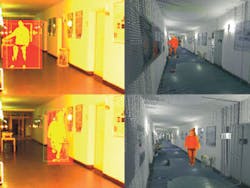
The SmartTrack video analysis architecture comprises multiple components: a robust background modelling unit is embedded in each smart camera that ensures reliable operation in changing natural environments. As soon as any salient motion is detected, a new tracking engine is instantiated with the current appearance as target running at more than 20 frames/s. Each tracking unit can handle multiple hypotheses (multimodal probability density functions) and nonlinear systems.
Multiple people can be tracked independently of each other. A handover unit ensures tracking when a person leaves one camera’s field of view and enters another. Tracking is implemented by converting the 2-D tracking results in image domain of the respective camera to a 3-D coordinate system with respect to the georeferenced 3-D model. Besides the tracking unit, an activity-recognition and classification engine, based on the lastest machine-learning techniques, is embedded within each smart camera node.
VISUALIZATION SYSTEM
SmartSurv provides an intuitive visualization system, SmartViz, that can integrate the results of the whole sensor network in one consistent and georeferenced model. Instead of showing raw live video streams, only the relevant information is presented in one of the available visualization options. The results of multiple such installations can be integrated in one model.
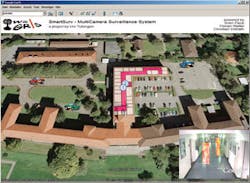
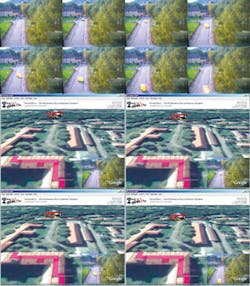
All video analysis results of all objects within a SmartSurv camera network installation can be seen in real time, where each object is visualized either as live texture (see Fig. 2) or as stylized icon for increased privacy (see Figs. 3, 4). The viewpoint within Google Earth can be chosen arbitrarily during runtime, independent of the objects being tracked and independent of the camera nodes.
In addition, both indoor and outdoor surveillance is covered concurrently and combined in one model. As the security personnel observe people walking through an area, they do not have to care which camera is involved in this tracking activity. Hence, they do not have to deal with observing one camera level any more. If the perimeter size or camera coverage is to be extended, adding more smart camera nodes will solve this problem. Neither technical constraints such as overloaded network bandwidth or server installation or functional constraints would introduce any problem.
A second visualization option is based on 3-D models acquired by a mobile platform containing a laser scanner and panoramic camera, which is the subject of current research at the University of Tübingen (see Fig. 5). Besides the SmartViz interface in this option, the results of the SmartTrack network can be integrated in any action chain, such as sending alarms to mobile phones, security companies, or the police.
The SmartSurv group is looking at many applications for which the system could be commercialized, including tracking shopping patterns, observing properties, and monitoring the elderly. Our spinoff company has been founded in collaboration with Matrix Vision and the University of Tübingen to pursue commercialization options for this surveillance system.
Sven Fleck founded SmartSurv Vision Systems and was formerly with the interactive graphics systems group at the University of Tübingen,Tübingen, Germany; www.smartsurv.de.
null
