Imaging systems tackle color measurement
Off-the-shelf FireWire cameras and spectrometers ease the task of color measurement.
By Andrew Wilson, Editor
There’s an old saying that although there may be more than one way to skin a cat, you get only one try per cat. In building machine-vision systems, developers can choose from a number of different components to perform any specific task. By studying product application notes and successful integration stories, system integrators are in a better position to lower the cost of a particular system by choosing the correct lighting, lenses, and cameras to meet the needs of their application.
However, the choice of a particular product or combination of products may not be the sole way of tackling any specific machine-vision task. In developing machine-vision systems to measure color, for example, many products with different price points and features exist. As in other areas of machine vision, the choice of which product to use is subjective, based on the specific application to be solved and further complicated by the nature of color itself.
Much of the pioneering work on human color perception was done by the Commission Internationale de l’Eclairage (CIE), which developed a method for associating three numbers (or tristimulus values) with each color. These three numbers or color coordinates are specified as XYZ values that roughly correspond to red, green, and blue, respectively. Since such color space theory was introduced in the early 1930s, hundreds of color space derivatives have been introduced (see Vision Systems Design, June 2007, p. 70).
Perhaps the most common of these are red, green, and blue (RGB); hue saturation and intensity (HSL); and Lab, where L describes the luminance and a and b the color-opponent dimensions, based on nonlinearly compressed CIE XYZ color space. However, while RGB and HSL color spaces are nonlinear with respect to human perception, Lab is more perceptually linear than the XYZ color space. Thus, a change of the same amount in a color value produces a change of approximately the same visual importance
To properly communicate color, each color must be specified by three coordinates. In the simplest case, an RGB camera can be used to produce a color value with RGB coordinates that can then be transformed into several different color spaces.
These cameras themselves use different methods to digitize color (see “Cameras use multiple methods to digitize color,” p. x). In more complex systems, a sampling of values is measured across the approximate 400-700-nm spectrum of visible light. This digital sampling of the color spectrum can be accomplished in a number of ways, including the use of diffraction gratings to slice the light into multiple wavelength components or by using filter wheels to sample the spectrum at various wavelengths.
ENGINEERING SOLUTIONS
Unfortunately, as Glenn Archer, director of business development at EPIC Vision Solutions (EVS), points out, choosing a color measurement system is only part of providing a complete color measurement solution. “In building color inspection systems, only a small set of lighting components can be used,” he says. “These include fluorescent, white LED, quartz halogen, and metal-halide lamps. Furthermore, the lighting technique chosen must result in accurate, repeatable color detection.”
These problems came to light as Archer and his colleagues developed a system designed to inspect plastic extruded parts produced in a variety of colors. “In the past,” says Archer, “operators sampled these parts using hand-held spectrometers. These would only inspect small regions of the material and were not useful at measuring the color of contoured parts with shadows and multiple colors. Worse, they could not be set up to detect spots or stains on the product,” he adds.
To illuminate the parts for manual color measurement, fluorescent lights with high frequency ballasts were used. “These lights cannot be used in such applications,” says Archer, “since just a 15° change in temperature results in reflected light intensity changes of 8% to 20%. Many of today’s RGB color cameras are also temperature dependent. We have found that an 8° temperature change can shift RGB values by 3%, in a nonlinear fashion.”

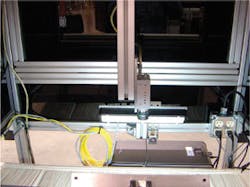
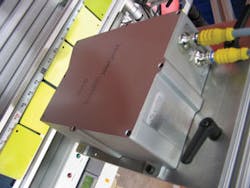
To overcome these limitations, EVS developed a system that uses dual LED lighting strips angled at 45° to illuminate either side of the extruded parts (see Fig. 1). Imaging the parts was accomplished using a 1600 × 1200 PL-B774F FireWire camera from PixeLINK. “Because the camera provides an on-board look up table and illumination correction,” says Archer, “the RGB output of the camera could be dynamically changed should any temperate change occur. Of course, to do so requires that the camera’s output be calibrated against a range of temperature measurements.”
COLOR SPACES
The color space our customer wanted to use for evaluating its process was CIELab, a color space that works well for quantifying color differences that the human eye would see. Archer notes, “However, what is perhaps most important and what system developers should care most about is whether color systems can meet or excel those of human perception.” It was this criterion that proved most important in the design of the system.
To inspect large areas of extruded material, the PixeLINK RGB camera is triggered at 20 frames/s as parts move along a conveyor. RGB images are then transferred to a host PC over the FireWire interface. To transform the RGB values to Lab coordinates, Archer and his colleagues used the Vision Development Module collection of image processing and machine-vision functions from National Instruments (NI). NI’s LabView software package was also used to build the graphical user interface for the system.
Lab space decomposes color into a luminance value (on the y axis) and two color opponent dimensions - “a” from red to green and “b” from yellow to blue (see Fig. 2). “A woman’s eyes are more sensitive than a man’s, and this is why women rather than men are often used to inspect products such as extruded plastic parts, where there may be very little difference in luminance and color components,” Archer says. He adds, “Some women even have extra cones (color sensors in the eye) and see color differentiation much more finely. So our inspection system has to work as well as the best human inspector.”
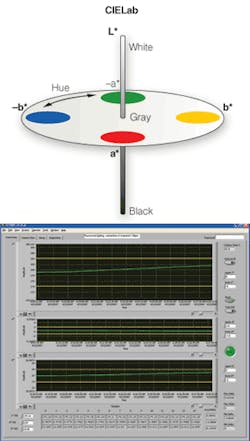
In the user interface developed by EVS, amplitude values of all three coordinates are plotted as a function of time. “Interestingly,” says Archer, “while a 0.5% difference of luminance values is imperceptible to a human operator, a difference of 1% is perceptible. Similarly, a 1% difference in amplitude in either a or b values will also be perceptible.
While the system developed by EVS uses average values of RGB to compute the Lab coordinates, other color measurement systems sample the 400-700-nm visible spectrum at multiple points. By doing so, these instruments more closely resemble traditional spectrophotometers since they make measurements at specific intervals along the visible region, which result in a series of spectral reflectance curves. These curves can be used to generate color profiles of specific objects and to generate color datacubes of the image being inspected. Such datacubes match the x-y position of the object in space and plot the spectral reflectance curves of each pixel measured in the z dimension.
SLITS AND WHEELS
Several methods exist to measure the spectral reflectance curve of reflected light (or color) at numerous points across the spectrum. At Resonon, for example, this is accomplished with the use of a diffraction grating placed behind a small linear slit in the body of the company’s Pika II digital FireWire imaging spectrometer. To achieve a similar effect in its VeriColor Spectro non-contact spectrophotometer, X-Rite uses a wheel with 31 tightly specified interference filters that is rotated between the viewing optics and the calibrated optical sensor to provide true spectral and colorimetric data.
In the design of the Pika II, visible and near-infrared light between 400 and 900 nm passes through a narrow slit and onto a diffraction grating. The Pika II currently uses a 648 × 488 Flea 2 FireWire camera from Point Grey Research to capture these images. This light is then decomposed by wavelength into as many as 240 different channels at up to 135 lines/s. As an object moves across the field of view of the imaging spectrophotometer, a 2-D image is built up line by line, with each pixel in a line containing the full spectral information in ~2-nm intervals.
“Because the Pika II is operated in a pushbroom fashion,” says Tim Hirzel, a software architect with Resonon, “objects moving along a conveyor belt can be imaged and digitized in real time.” The image can then be viewed as a function of wavelength at any pixel.
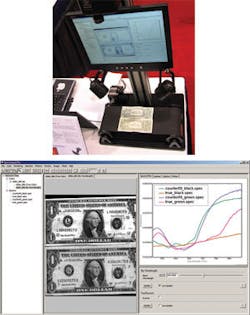
Hirzel and his colleagues recently demonstrated the effectiveness of the system’s ability to discern subtle differences in color using the high-resolution spectral information by comparing images of real and counterfeit US currency (see Fig. 3). Using consistent illumination across two $1 bills, the spectra from the two bills were compared using 120 bands of color with a spectral imaging algorithm known as Spectral Angle Mapper (SAM). Results from this comparison were displayed as a single number for each pixel. Although not discernable to the human eye, the top forged bill was clearly identified.
Using the company’s Spectronon software, spectral data from captured images can be rendered in a number of different ways including traditional RGB, CMYK, and CIE Lab values as well as raw spectra that can be analyzed using hyperspectral algorithms.
HOW MUCH IS ENOUGH?
But how much resolution is enough? Again, this is completely dependent on the accuracy of the color needed by the end-user. “In Lab space,” says Ken Phillips, product manager with X-Rite, “Delta-E is used to mathematically describe the distance between two colors. To calculate delta-E between two colors, their Lab values must first be calculated.” Once these values are known, the delta-E can be calculated from the L, a, and b values using
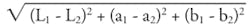
null
“While the average observer notices the difference between two colors 3 to 4 delta-E apart, trained eyes can differentiate two colors between 1 and 2 delta-E apart,” says Phillips. “However, because the human eye is sensitive to changes away from achromatic tones (represented by a and b values close to 0), differences between two grays that are as close as 0.5 delta-E apart can be seen.”
Unlike Resonon’s Pika II that uses a diffraction grating to obtain samples across the visible spectrum, X-Rite’s Vericolor Spectro uses a 31 filter wheel that is rotated in front of a sensitive optical detector (see Fig. 4). Each filter’s sample then represents a 10-nm slice of bandwidth across the spectrum. “Simply observing three RGB values does not provide accurate color measurements for precise applications such as color paint analysis and plastics manufacturing,” says Phillips. “Like a ruler, RGB can measure color in inches, while VeriColor Spectro measures in 1/16 in.” However, because the VeriColor-Spectro uses a filter wheel design, measurements of an object are limited to one color measurement per second. “In essence,” says Phillips, “the Vericolor Spectro system bridges the gap between systems that use standard RGB cameras and higher resolution spectrophotometers for more accurate in-line noncontact color measurement.”
Developed for production-line environments, the VeriColor Spectro can be programmed using a PC interfaced to the instrument over an RS-232 interface. “Because the Vericolor Spectro also features both RS-485 and optoisolated outputs it can be directly interfaced to PLCs and production-line triggering mechanism, where it can operate in stand-alone mode,” says Phillips. With a worst-case repeatability of 0.05 delta Eab, the system provides the performance of a lab-grade spectrophotometer in an affordable and robust in-line non-contact solution.

Cameras use multiple methods to digitize color
Originally designed to support transfer rates of 100, 200, and 400 Mbits/s, the FireWire 1394a digital camera interface is a serial bus that provides deterministic performance, isochronous data transfer implemented over small camera cables, and connectors. Its backwardly compatible successor, IEEE 1394b, now provides data transfers of 800 Mbits/s and, like the 1394a standard, has been widely adopted by many vendors of color CCD and CMOS cameras.
Many different options exist to digitize color images using these cameras, including using monochrome high-resolution cameras coupled to filter wheels or cameras with CCD or CMOS imagers that incorporate Bayer filters. Alternative implementations use three CCD or CMOS imagers coupled to a prism block to split the light into red, green, and blue components or cameras that incorporate sensors with a stacked pixel designs. While each of these approaches has its own price/performance trade-offs, the choice technology is highly application-dependent.
In applications such as microscopy, for example, high-resolution, spatially registered color images with high signal-to-noise ratios are required. In these applications, large-format CCD- or CMOS-based monochrome FireWire cameras can be used in conjunction with filter wheels to capture RGB images with 12 bits/pixel in each RGB plane. Rather than use mechanically selected filters and acousto-optical or liquid-crystal filters that require software control, Q Imaging offers a series of electronically tuned filters for its line of cameras. Color information is captured by sequentially acquiring full-resolution images in each of the color planes by switching the filter through RGB states under direct control of the camera hardware.
Of course, depending on the type of camera used, the additional filters in the optical path of the camera can cause some loss of light transmission and increase the camera’s integration time. When faster integration times are required while at the same time preserving high resolution, system developers can consider the use of using cameras based on three separate CCD or CMOS imagers.
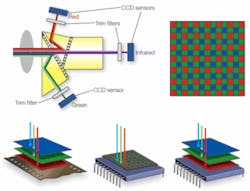
Three-chip cameras use a prism that splits lights into three RGB color components. Light from each of the colors is digitized by a CCD or CMOS imager that is then combined to create a full-color image. Because these RGB colored pixels are precisely registered, a high-spatial-resolution dynamic range is preserved. This is the principle behind the IK-TF7 three-chip color camera from Toshiba America Imaging Systems Division. Having three progressive-scan CCDs, the Camera Link-based camera features three image sensors each with 1024 x 768 pixels and can output 90 frames/s.
Designing the cameras with three imagers and a prism to capture color images, instead of using a single device, can add cost. To reduce this cost, Foveon has developed a direct image sensor that directly captures red, green, and blue light at each point in an image during a single exposure. And, at the International Robots and Vision show (Rosemont, IL, USA), Toshiba Teli America announced that it had incorporated a Foveon X3 1/3-in. CMOS progressive-scan sensor into its new 3Layer FireWire-B 5-Mpixel camera.
The result, according to the company, is a color image comparable to that of a 3-CCD-based camera at a lower price. Suited for microscopy, machine vision, medical, and industrial imaging applications, the 3Layer camera features a 1400 × 1050-pixel imager with 5-µm-square cells from each of its three layers (RGB). Stacked together, the layers capture 100% color at every pixel location with no interpolation. The frame rate of the camera at full resolution is 6.5 frames/s.
Such sensors, however, still have not been widely incorporated into color cameras, especially for machine vision. Where very-high-resolution spatially registered color images with very high dynamic ranges are not required, CCD and CMOS based cameras that incorporate the Bayer color pattern are still widely used.
Vendors such as Allied Vision Technologies, Basler Vision Technologies, and Prosilica use off-the-shelf CCD and CMOS imagers from vendors such as Sony Electronics and Micron Technology in the design of their cameras. To create a full-color image, Bayer interpolation generates color values for each pixel, creating a full three-channel RGB color image. In modern CCD cameras, this interpolation can be accomplished either in the camera’s FPGA or later on raw color data in the host computer.