Digital imaging examines laser-printed documents
Off-the-shelf components and custom algorithms perform forensic analysis of print used in crime.
By Jack Tchan
Forensic analysis of print is crucial for combating fraud and counterfeiting crimes. Counterfeiters and document fraudsters often escape prosecution because of the difficulty in establishing a connection between them and their printing equipment that is sufficient to satisfy the courts. The problem is exacerbated by the wide range of inexpensive and high-quality laser and inkjet printing machines available on the market. To meet these challenges, the London College of Communication (LCC) forensic research program is working to improve the methodology of ‘fingerprinting’ printing machines using high-resolution digital image analysis.
The sophistication of the method required to resolve fraud and counterfeit cases varies according to the quality of the reproduction and whether visible distinguishing marks are present. The naked eye or magnification is sufficient in many cases. If the reproduction is expertly done or there are no obvious distinguishing marks such as heavy print-roller scratch marks then special techniques must be applied.
Chemical analysis is frequently used in the forensic analysis of laser print. However, disposable toner cartridges create a problem, as vital evidence can be destroyed if a cartridge has been replaced. A replacement toner or ink cartridge may have a different chemical composition, rendering chemical analysis inconclusive. Furthermore, paper evidence is destroyed during the process of chemical analysis.
A technique recently under development by the United States Secret Service Forensic Science Division involves the use of electrostatic detection apparatus to reveal faint paper-feed-roller marks. A voltage of up to about 10 kV is applied by corona discharge to the document in question. This will reveal roller marks, which vary from machine to machine and which can be measured by applying toner to the paper. However, there is no guarantee that the roller marks will always be conclusive evidence. Moreover, the toner applied to the paper substrate can also harm the evidence
digital image analysis
Digital-image-analysis techniques can be applied to analyze patterns generated in print due to irregular movements by the print engine. These irregular movements cause lines to be printed across a page when solid smooth print is required and is known as banding. The effect has been attributed to two causes: fine banding due to the imbalance of the rotor component of the polygon mirror or mechanical weaknesses of the laser scanning unit and rough banding caused by unsteady motion of the photoconductor drum or the fuser unit. The patterns due to banding vary from printer to printer and can be used to link a document to the printer that produced it.
The banding effect can cause the size of print to vary across a page in patterns that differ according to the printer used. Size variations are imperceptible to the eye and to be quantified require precise measurement using digital image analysis. The effect has been identified and measured using a digital image analysis system developed at the LCC especially for this task.
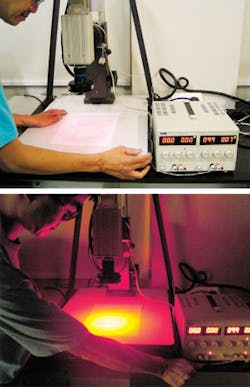
A high-spatial-resolution digital-image-analysis system has been built that comprises a Hamamatsu C4742-95-12NRB monochrome digital CCD camera. The important feature of the camera is that the CCD chip is Peltier-cooled to increase its signal-to-noise ratio. The use of a high-quality Linos Mevis C lens to magnify the object image enhanced the resolution of the images produced by the camera. The accuracy of the measurements was also assisted by using a red LED light source from a DF-LDR-90, supplied by Firstsight Vision and manufactured by CCS. The illumination system was powered by a TTI EL302D power supply supplied and calibrated by RS Components. The camera was mounted on a heavy Polaroid MP4 Land camera stand to eliminate vibration problems (see Fig 1).

The image data from the camera were digitized to 8-bit resolution using a Matrox Imaging Meteor II/digital frame-grabber board and MIL-Lite software. The data were subsequently analyzed using Matrox MIL-Lite and ActiveMIL controls that were compatible with Visual Basic 5.0. Algorithms were developed so that length measurements on individual graphic objects and text characters could be made.
Included in the algorithm was code to enable automatic multiple shots of images to be taken for averaging to reduce noise. Also, error-correction code was written to correct systematic errors in the output from adjacent rows of cell of the CCD chip. The measurement procedure adopted a method of edge detection from which the length of graphical objects, letters, or words could be calculated.
Developing the algorithm
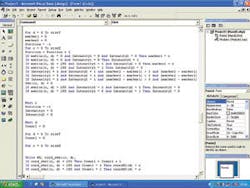
The image-processing and analysis algorithms were developed in Visual Basic because it is easier to use than Visual C++, and processing speed was not the most important consideration. The code can be translated into C++ at a later stage of the project if required. This is possible since Matrox MIL is also compatible with Visual C++ (see Fig. 2 on p. 52).
The data from the frame grabber were captured and translated into an Excel .csv file format using Visual Basic and the ActiveMil controls. These data were contained in an 8-bit 2-D matrix. Therefore, the raw data and any changes in the data by subsequent mathematical operations on the matrix could be viewed easily in a large Excel spreadsheet.
A small block of Visual Basic code was written that enabled multiple shots to be taken. The data from this procedure can then be averaged to reduce the effects of both electronic noise and mechanical vibration. This is an option that can be used experimentally to improve the accuracy of the system. However, it can noticeably increase the data-processing time. The algorithm and software were developed experimentally with the digital image-analysis system set at a magnification of about 1050 pixels = 1 cm (see “Algorithm development,” p. 53).
By scanning the image for sharp changes in intensity in neighboring pixels, edges caused by paper-to-print or print-to-paper transitions were found. This was achieved by a raster scan of the image matrix. The sharp changes in intensity were recorded as marker pixels. All of the marker pixels were designated the same unique value to identify the print edge pixels from all the others.
A process of thresholding enabled noise that produced false print edges to be eliminated. The genuine edge pixels could be discriminated from noise since the edges produced by the print very frequently had continuous rows of more than one marker pixel, typically five. Edges produced by noise rarely had more than one adjoining marker and could be eliminated by thresholding.
The exact location of the edge was determined by taking the first and last markers representing an edge and determining the midpoint. For odd numbers this is exactly the middle pixel, for even numbers the lower valued of the two middle pixels was used. This thins the edge to one pixel thickness. The length of the object can be found by thresholding for a fixed number of pixels in the y direction. Typically this number was seven. Since each line rarely even contained one marker pixel produced by noise, the measurements were consistently accurate. Then the threshold position of the first thinned edge was subtracted from that of the second to find the length.
Finally, it was discovered that the camera produced a systematic error. It appeared that adjacent rows of the CCD responded differently to the same light levels. The evidence for this was that for a given threshold, the population of marker pixels always rose and fell or vice versa sequentially from row to row.
The effect of this was that the system determined length with a unit of measurement biased toward two pixels instead of one pixel. To reduce this effect a weighting factor was applied to the alternate rows with lower values.
Typical results
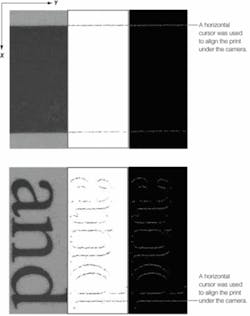
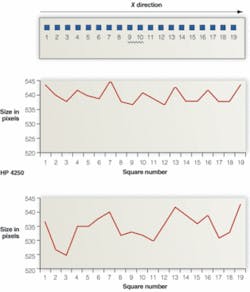
For example, sets of squares were produced from two Hewlett-Packard laser printers: an HP 4250 and an HP 1200. The horizontal length of each square was measured by edge extraction and thinning using the algorithm (see Fig. 3). Distinct patterns in the horizontal length of each square exist across the page and can vary for different print engines (see Fig. 4). It has been shown that the patterns do not vary even after 400 prints have been made from a printing machine. Different models of printing machines can also be distinguished when text characters down to 12 points in size are used to test the system.
The results of the ongoing investigation at the LCC demonstrate that it is possible to apply the method to analyze documents in fraud or counterfeiting cases. More significant results may even be found by also analyzing the print in the vertical direction.
Inkjet printing is another area to be investigated. The success of the pilot investigation, which also involves the analysis of individual text characters, suggests that a more advanced camera should be used, since the camera is not the latest model by Hamamatsu. In the longer term, the development of a scanner-based system would automate and speed up the data-acquisition process
JACK TCHAN is member of the Materials and the Arts Research Centre (MATAR), forensic science research, at the London College of Communication; j.tchan@lcc. arts.ac.uk.

null
Algorithm development
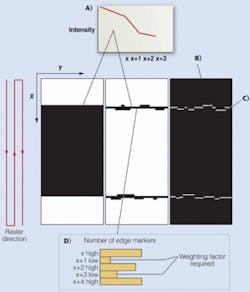
A. The edges of the printed regions will have large magnitude intensity gradients. A threshold operation can be used to identify the approximate positions of the edges.
B. The edges can be discriminated from the noise since they are formed by continuous rows of marker pixels, while noise is formed by isolated single marker pixels. The continuous rows of marker pixels can be thinned to 1 pixel thickness by finding the midpoint positions of the rows to establish a more precise position for the edge.
C. The number of pixels along each y row are counted and by thresholding the actual print edge positions can be determined. For example, to determine the distance between adjacent edges, which is the length of the print region, we can set the threshold as seven marker pixels per line. The noise will be filtered out since it is unusual to find more than one noise edge pixel in any give line. The length of the print region is found by subtracting one adjacent row of markers from the other.
D. Camera-correction software is required since adjacent rows in the y direction produced a systematic error where the intensity response of the CCD camera alternated in its sensitivity to illumination.