Setting the Standard
Andrew Wilson, Editor
In 1989, Kendall Preston of Carnegie-Mellon University wrote what has come to be a definitive paper for IEEE Computer (http://www.computer.org/portal/site/computer/) on machine vision entitled “The Abingdon Cross Benchmark Survey.” In his paper, Preston determined that since no benchmark was readily available to benchmark “image processing computers,” he would devise his own. The result, named after the town of Abingdon in England, where Preston attended a meeting on architectures, algorithms, and languages for image processing, was the Abingdon Cross benchmark.

Approximately 100 government, industrial, and university groups participated in the Abingdon Cross benchmark, and in his paper Preston published the results obtained from testing more than 50 now obsolete machines, including those built by Gould Imaging Systems, MegaVision, Vicom, and Pixar.
Designed to compare the performance of image-processing architectures, the Abingdon Cross benchmark (see Fig. 1) presents the imaging system with a cross located in a noisy background and the aim of the imaging system is to determine the medial axis of this cross. In developing this benchmark, Preston realized that a number of different algorithms could be used to perform the task and so the benchmark only considers the total execution time.
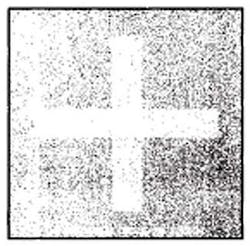
To determine the medial axis, however, both linear and nonlinear functions must be used. After performing edge detection and background separation, connectivity-preserving thinning must be used. After the total execution time for all the steps required is measured, it is used to compute the performance/cost ratio vs. a “quality factor” that takes into account the size of the image and time taken to compute the medial axis.
In tabulating his results, Preston asked more than 100 companies to submit data, approximately 50 of whom responded. One of those companies was Datacube, where Shepard Siegel, Emmy-award winning engineer and now chief technical officer of Atomic Rules, submitted results from the company’s MaxVideo image-processing board. Attaining one of the highest ratings in the survey, the board outperformed nearly all of the other 50 products benchmarked performing both linear and nonlinear functions in hardware.
Just how fast
Despite the advances made in both hardware and software over the nearly 20 years that have passed since the development of the Abingdon Cross benchmark, today’s systems developers are still faced with individually benchmarking their machine-vision and image-processing systems. Although the Abingdon Cross benchmark still remains viable, it is perhaps lacking in being able to properly evaluate the latest algorithms and hardware implementations being used by systems developers.
Several reasons exist why a new benchmark—one that considers both image-processing software and any hardware implementations—should now be developed to evaluate the performance of imaging systems. “I think that a new benchmark would be helpful for many people in their decision-making process, but I am not sure I would go so far to say it would be required,” says Matt Slaughter, product marketing manager for DAQ, vision, and motion at National Instruments. “For many end users, all-out performance may not be all they are looking for and a large majority is more concerned with how well a vision system interfaces with their current system.”
In considering any new benchmark, it should be remembered that the most important aspect of the Abingdon Cross benchmark was not which algorithms were used to perform the task of determining the medial axis of the cross but how fast the task itself was performed. This final speed was calculated irrespective of whether the task was performed in hardware or software. In developing a more effective benchmark, the same hardware/software-agnostic approach should be taken while presenting each individual system with a standard test image.
Because of the nature of the disparate types of optics, lighting, and cameras used in today’s machine-vision systems, this standard test image could not be supplied in hardcopy format similar to a TV test or color Macbeth chart. If it were, then the different types of lighting, optics, and image capture devices would skew the resulting data, making any comparison difficult. Although supplying such an image benchmark in a digital format would overcome this difficulty, it would simultaneously limit its use to systems that consisted of a hardware/software combination that can perform a variety of machine-vision tasks.
Smart camera and FPGA board vendors—those that provide sensor, processing, and operating system support—could still use this benchmark. However, those semi-smart cameras and FPGA boards that provide only partial preprocessing functions such as flat-field correction and Bayer interpolation in on-board embedded gate arrays could not be benchmarked. “In software there is no actual limitation in the data size of the algorithm. However, since FPGAs have limited resources, the question for such hardware vendors will be whether the algorithm fits into the FPGA,” says Michael Noffz, head of marketing with Silicon Software. Despite this, any new benchmark would provide systems integrators with overall price/performance data that could be used as a guideline when evaluating machine-vision and image-processing software.
Developing the tests
In developing such a benchmark, it is first necessary to evaluate the limitations of the Abingdon Cross benchmark. To do so requires an understanding of both the algorithms currently offered by the major software vendors and how they are used to solve typical machine-vision applications. Only then can a benchmark be developed that tests the capability of each company’s hardware/software offering. Although the Abingdon Cross benchmark does perform both linear and nonlinear image operations, it is impractical in the sense that it cannot be used to evaluate the common problems faced by systems developers.
In his article, “Applying Algorithms” to be found on page 17 of this issue, Ganesh Devaraj of Soliton Technologies and his colleagues point out that in 35 applications that they have developed, all 35 were solved with just five image-analysis applications. Specifically, these are blob analysis, edge detection, computation of average intensity, and fitting a straight line and a circle. However, the many systems described over the years in Vision Systems Design rely on a number of other algorithms that use point, neighborhood, and global operators (see “Image-capture boards speed vision tasks,” Vision Systems Design, November 2005).
While point processing functions can be used, for example, to adjust the contrast, neighborhood operators such as image filtering use convolution kernels to find relevant edges from which further computations can be made. These neighborhood operations can be used in the Abingdon Cross benchmark to eliminate the noise associated with the image. Other neighborhood operators are used in functions such as Bayer interpolation to render RGB data from Bayer-based cameras. While point and neighborhood functions are useful, image segmentation, feature extraction, or interpretation require global image-processing functions best performed by von Neumann-like architectures. Examples of these types of functions are used in watershed operators and optical character recognition (OCR) systems.
Of course, other algorithms also play an important part in many imaging systems. Perhaps the most important of these is geometric pattern matching, a function now offered by many software vendors that allows the shape of an object to be rapidly located. To perform this function, an imaging system is first trained with a known good object and then the algorithm searches the captured image for objects that appear similar, independent of their orientation, size, and shading. This function is especially useful in robotic pick-and-place systems that are required to perform automated packaging in factory automation systems.
In many imaging systems, differentiating colors of product is also required. To do so, many of today’s sophisticated color analysis systems transform any RGB data into lab coordinates before performing this color difference measurement (see “Imaging systems tackle color measurement,” Vision Systems Design, August 2007). Such systems have already found use in discriminating the difference between difficult-to-discern colors between plastic parts and analyzing forged currency.
Today, many companies offer software packages for machine vision and image processing. Most of these incorporate point, neighborhood, and global operators to perform specific applications such as image addition and subtraction, geometric pattern matching, edge detection, noise removal, color analysis, and polynomial warping. Despite this, no benchmark exists that allows a systems integrator to independently evaluate how fast and accurately such functions will perform in machine-vision applications.
A better benchmark?
Because of this, a new machine-vision benchmark is required to test how fast real applications be solved using today’s commercial hardware/software combinations. Building on the Abingdon Cross benchmark and the TV test charts of the past, the MVB would encompass a series of images. While each individual element on the benchmark could be used individually to test a specific machine-vision function, the effect of testing all of these images for specific tasks would provide a greater overall picture of the performance of the individual vendor’s software. This would also enable the use of region of interest (ROI) processing on either FPGA, multicore, or graphics processors (GPUs), allowing each individual vendor to fully highlight the performance of their software (see “Optimizing machine-vision software for parallel processing,” page 91).
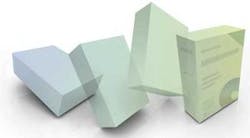
In essence, the first image of the new benchmark would be the Abingdon Cross benchmark. This would allow a benchmark of edge detection, background separation, and connectivity-preserving thinning algorithms to be evaluated. A digital test chart image (see Fig. 2) would not be used in its normal fashion to profile video monitors, digital televisions, or printer resolution. Rather, the elements, lines, and circles within would be used to test the accuracy and speed of the machine-vision system.

Given such a benchmark, a number of tasks could be performed but, given the other operations required to be performed in the benchmark, these should be limited to the measurement of the line spacing and the Delta E difference between each of the colors. Since the colors and line spacing would be known to pixel accuracy, the measured deviation from the norm would provide a measure of the software’s measurement and color analysis accuracy.
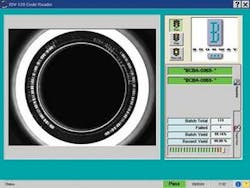
To define the speed and accuracy of both image warping and OCR, the image (see Fig. 3) would contain OCR characters around the middle of a compact disc (CD). To perform the correct OCR, the software would need to perform both a polynomial warping of the image followed by OCR. “This OCR test should also address more challenging applications such as OCR printing with the image containing corrupted characters and unaligned character strings,” says Pierantonio Boriero, product manager with Matrox Imaging.
Where color image processing is required, one of the most often used algorithms is Bayer interpolation. In essence, raw RGB data from a camera is presented to the image-processing system and a color image must be derived from the image. Because numerous methods of Bayer interpolation exist that each produce different image quality (see “Cameras use Bayer filters to attain true color,” Vision Systems Design, September 2004), a raw RGB image would be included. Rather than simply perform Bayer conversion of this data, however, two color circles of different color would be located in the image and the distance between their circumferences measured. By also measuring the extent of artifacts at the color boundaries of these images, both the accuracy and the speed of edge detection, best fit, and accuracy and speed in color measurement tasks would be returned.
As some of the most important machine-vision functions, grayscale correlation and geometric pattern recognition need to be included in any benchmark. To do so, an image of a part would be presented to the system followed by the part to be matched. This part would be purposely oriented at 45°, reduced in size by 20%, and shaded a different color. Any geometric or pattern-matching algorithm would then be required to return the center of gravity of the part.
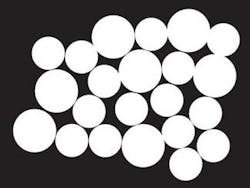
Morphological operators also play an important role in many machine-vision applications. When multiple parts, such as washers, overlap on conveyor belts it is vitally important to count or locate each image so that it can be properly sorted by size. Once again, there are numerous methods to solve this problem and any specific test image designed to benchmark the speed of such a task must be algorithm independent. To test the speed of this, the test image (see Fig. 4) could consist of a number of connected circles. To properly count this, a morphological operation is used, after which the center of each circle must be determined and its location in x-y space returned.
null
The robustness question
Despite the benefits of benchmarking pattern recognition, the issue of robustness must also be addressed. “It is important to note that speed alone is not a substitute for accuracy and repeatability,” says Bruno Menard, group leader of image processing at DALSA. “Customers will expect such benchmarks to compare accuracy and repeatability of a given algorithm before evaluating speed. It is more costly to deploy an algorithm that produces accurate results only half the time than a similar algorithm that runs half as fast but produces accurate results every single time!”
Thor Vollset, CEO of Tordivel, agrees with Menard. “To verify real-world performance such a benchmark should incorporate tests that use sequences of images from a real production process,” he says. To accomplish this, the image-processing system would be presented with 25 “good” parts, 25 with “marginal” fails, and 25 with “large” errors. On each part location, x-y position, a specific angle on the part, the size of the part, and one radius measurement and two distance measurements should be made. Then the system would be required to provide percentages of the number of parts measured, the parts properly located, and those that could not be measured. Returning a standard and mean analysis time would then provide both a measure of the accuracy, speed and robustness of the system.
While developing such a benchmark may be a relatively easy task, it will, like the Abingdon Cross, require the participation of numerous vendors. “The biggest roadblock in the way for such a benchmark would be obtaining the participation of all the vendors,” says Slaughter, vision product manager at National Instruments. “Many manufacturers out there may be cautious to release exact benchmarks against other systems.”
Boriero sees other problems. “Vendors can end up focusing on tuning their software for standard benchmarks rather than for a specific application,” he says. “This happened in the graphics industry where certain graphics vendors were cheating to get better results in standard benchmarks.”
However, once properly formulated and developed, a single, albeit rather large, image test file could easily be distributed to machine-vision software vendors. When the results are finally correlated, systems developers will be provided with a way to rapidly analyze the speed of many—if not all—of the most important algorithms used in today’s applications.
Optimizing machine-vision software for parallel processing
Vendors of machine-vision software are now leveraging the power of multicore processors to increase the speed of image-processing algorithms. To do so requires parallelization methods that can be either automatic or adjusted by the programmer to increase the speed of each algorithm.
In automatic parallelization, the number of available CPUs is detected by the software, which then splits a target image into a number of logical sub-images, passes these to multiple processing threads, and after processing, combines the image. Such software can also allow the programmer to process multichannel color images, process image sequences, or perform tasks such as contour analysis.
While parallelization can be used to speed up certain applications, in some cases, parallel processing can be slower than sequential processing. This is dependent on the size of the image to be processed, memory throughput, and the number of CPUs used.
To assist developers in finding a balance between sequential and parallel processing, automatic hardware analysis can be used. In this way, the program automatically chooses appropriate parallelization settings to gain optimal performance. To make use of this feature, the programmer has no need to adapt the vision application. To run a specific application on new hardware, only the automatic analysis has to be run again.
—Wolfgang Eckstein and Lutz Kreutzer, MVTec Software
Company Info
Atomic Rules
Auburn, NH, USA
www.atomicrules.com
Carnegie-Mellon University
Pittsburgh, PA, USA
www.cmu.edu
DALSA
Waterloo, ON, Canada
www.dalsa.com
Matrox Imaging
Dorval, QC, Canada
www.matrox.com/imaging
MVTec Software
Munich, Germany
www.mvtec.com
National Instruments
Austin, TX, USA
www.ni.com
Silicon Software
Mannheim, Germany
www.silicon-software.de
Soliton Technologies
Bangalore, India
www.solitontec.com
Tordivel AS
Oslo, Norway
www.scorpionvision.com