Specifying lenses for megapixel cameras
Gregory Hollows and Stuart W. Singer
Continuing advances in high-resolution sensors with higher pixel densities and smaller pixels are challenging optics manufacturers to produce lenses with increased performance. To understand how lenses can affect the performance of imaging systems, it is necessary to grasp the physics behind diffraction, lens aperture, focal length, and the wavelength of light (see “Matching Lenses and Sensors,”Vision Systems Design, March 2009). Other design limitations also restrict the optical capabilities of a lens, even before manufacturing tolerances are taken into account.
In specifying a lens and camera system for a particular application, it is not advisable to simply choose a 5-Mpixel lens, for example, in the hope that it will work with a 5-Mpixel camera. Before choosing such a lens, the effects of aperture (f/#), working distance, lens design, and tolerances must also be considered. Detailing the specific requirements of an application is critical before choosing correct optical components since this allows manufacturers to show how their components may meet these requirements.
Understanding MTF
One of the most useful benchmarks for describing image quality (lens performance) is the modulation transfer function (MTF). Unfortunately, since MTF can be specified in different ways, the performance of any given lens may appear higher than what is actually achievable.
To properly measure the MTF, an image of a target whose intensity varies sinusoidally in space is used. This sine-wave target always produces a sine-wave image, regardless of the resulting quality of the image. The only values affected by poor image quality are the contrast and phase of the image. When contrast is plotted against spatial frequency, the horizontal axis shows the spatial resolution in line pairs per millimeter (lp/mm) and the vertical axis shows the contrast at any given spatial frequency (or MTF) from 0 to 100%.
At some frequency, the contrast in the sinusoidal image will be too small to detect. This is the cut-off frequency of the lens. Even for lenses with no geometric aberration, there is always a cut-off frequency that is determined by diffraction. If diffraction is considered when determining the MTF, it remains the most comprehensive method of lens performance.
Before the advent of high-speed computers, MTF was calculated by ignoring any diffraction effects caused by the complexity of calculations required and the time taken to generate the data. Today, however, diffraction MTF should be the only MTF used to describe the performance of a lens.
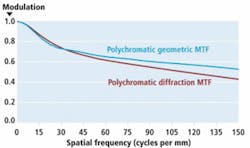
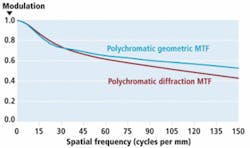
As a general rule, diffraction MTF data always produces lower lens-performance values than geometric MTF data by a minimum of 10%. For high-resolution systems that use 5-Mpixel cameras where it may be difficult to achieve contrasts of 20% this is incredibly important. In addition, MTF data should contain spectral information for the wavelength region in which the lens is used. For a lens operating in the 400–700-nm visible region of the spectrum, the most meaningful MTF data is known as polychromatic diffraction MTF.
Today’s 5-Mpixel sensors typically contain a pixel size equal to 3.4 µm. To accommodate such image sensors, MTF data must achieve a resolution of 147 lp/mm. To accomplish this, a lens design with an f/2.4 fixed aperture at 580 nm will produce an Airy disk (or spot size) of approximately 3.4 µm. The performance of this lens is commensurate with the 5-Mpixel sensor. When the polychromatic diffraction MTF data is compared with the polychromatic geometric MTF diffraction data, it can be seen that the polychromatic geometric MTF shows a 25% lower relative MTF performance at the 150 lp/mm frequency (see Fig. 1).
Because of the nonstandardization of optical data, numerous companies still present geometric MTF data to make their lenses appear to exhibit higher performance. Meaningful and valid information from the lens manufacturers should provide polychromatic diffraction MTF data so that their customers will understand true lens performance capabilities.
Aperture and distance
Even after understanding the correct way to interpret MTF curves, other factors need to be considered. These include the working distance of the lens and its aperture (f/#) since they will also affect the MTF of a lens and thus its performance. While MTF curves can show how a lens performs over a range of working distances and aperture settings, a new graph must be plotted for each distance and aperture.
This necessitates reviewing a large number of graphs to properly compare different products. However, by understanding how both working distance and aperture affect the achievable resolution of an imaging system, system integrators will be more effective at choosing specific lenses to meet their needs.
To demonstrate the effects of varying aperture and working distance, two different 5-Mpixel lenses from two separate manufacturers were examined at different apertures and working distances. Each lens has an MTF associated with it that implies it is capable of resolving images from cameras based on 5-Mpixel sensors. However, by examining images taken at the center and corners of images captured with these lenses, differences in resolution can be visualized.
By using a Ronchi rule target and an 8-in. field of view (FOV), the imaging system is first set to capture lines on every other row of pixels on the sensor. This allows each of the lenses to resolve images at the pixel limited resolution of the sensor. At this resolution, contrast levels greater than 25% are difficult to obtain, resulting in gray-level images. Camera noise is more easily visualized at these lower contrast levels.
The impact of this effect is seen most dramatically in images with lower levels of contrast. Using an aperture of f/2, both lenses A and B resolve 5-Mpixel images in the center sections of the image with lens B having a slightly higher level of contrast (see Fig. 2a and 2b). However, in the corner of the image, lens A can no longer resolve 5-Mpixel images at this particular aperture setting even though the lens’ MTF specification indicates that it can achieve 5-Mpixel performance (see Fig. 2c and 2d).
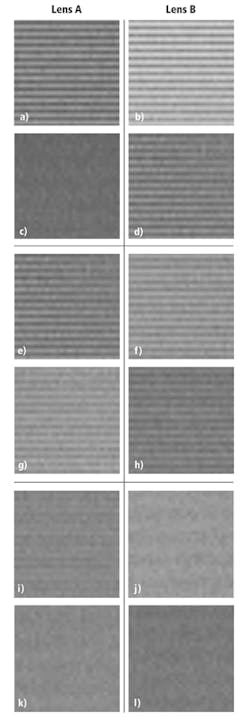
When the aperture of both lenses is set to f/8, both lenses still resolve 5-Mpixel images at the center sections of the image. The lower levels of contrast that are seen at the center of the image with the f/2 aperture setting show that diffraction is coming into play. At the corner of the images, 5-Mpixel resolution from both lenses is barely achieved (see Fig. 2e and 2f). Although this higher aperture setting overcomes certain aberrations and manufacturing issues (seen in the corner of lens A), this is at a reduced overall capability of the lens due to diffraction and reduced light levels.
By using an even larger aperture (f/11) and examining the center of the image, the diffraction limit of the system has been exceeded and no resolution is obtainable with either lens (see Fig. 2g and 2h). At this setting, neither lens can achieve any contrast at the corner of the images due to the diffraction limits of the systems (see Fig. 2i and 2j).
Working distance
Working distance also affects the performance of an imaging system. If the working distance of the lens varies, so does the FOV. Thus, different targets must be used to maintain pixel-limited image space resolution requirements. By examining the center and corners of each image, the different achievable resolutions of the imaging system can be visualized.
Using an aperture setting of f/2, a FOV of 8 in., and a working distance of 24 in., lens B resolves 5-Mpixel images (see Fig. 3a and 3b). With an aperture setting of f/2, FOV of 4 in., and a working distance of 12 in., this same lens is still capable of resolving 5-Mpixel images. However, at this working distance, the contrast level in the corner of the image is reduced (see Fig. 3c and 3d).
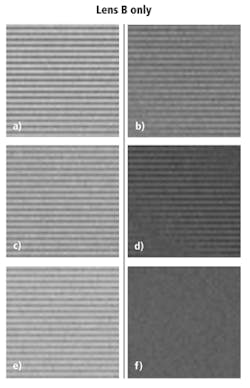
With an aperture of f/2, FOV of 1.5 in., and a working distance of 4 in., lens B shows no contrast at the limited resolution in the corner of the image. Even at higher apertures, no difference can be observed in the corner of the image (see Fig. 3e and 3f). Despite the fact that this is a high-performance 5-Mpixel lens when compared to other 5-Mpixel lenses, it still has its limitations.
The type of MTF data (geometric or diffraction) being presented by the lens manufacturers must be carefully considered and questioned at the time of lens selection. Furthermore, the fabrication tolerances should be stated in the MTF data of the manufacturer, and, if they are not, should be questioned before final selection. Factors like working distance, aperture, and wavelength range should also be considered to obtain the highest level of performance of the imaging system.
Although on paper a lens may appear sufficient for the required camera/sensor selected, closer examination may show otherwise. Lenses sold as megapixel lenses frequently vary in performance once the system is assembled and tested. Often, the performance of the lens is not commensurate with the sensor performance, and, if not, should not be classified as a megapixel lens.
Gregory Hollows is director of machine vision solutions, Edmund Optics (Barrington, NJ, USA; www.edmundoptics.com) and Stuart W. Singer is vice president of Schneider Optics (Hauppauge, NY, USA; www.schneideroptics.com).