IMAGING & ARCHEOLOGY: 3-D scanner digitizes ancient writing
For 3500 years, ancient Mesopotamian scribes pressed reed styluses into damp clay and generated millions of texts in various Ancient Near East languages. Since these documents were written on clay tablets, using a reed stylus, the impressions were wedge shaped, and are known as cuneiform texts (from the Latin cuneus, meaning “wedge”).
The texts include medical treatises, historical texts, mathematical and grammatical exercises, and even beer recipes. Now, using a novel 3-D scanner developed at Johns Hopkins University’s Applied Physics Laboratory (Laurel, MD, USA; www.jhuapl.edu), these clay tablets can be digitally archived and published and provide researchers with high-quality, 3-D images of the world’s oldest written documents.

“As the tablets are composed of wedges imprinted into clay tables with writing typically on all sides, photography and other forms of 2-D digitization were inadequate. What initially began as a search for an existing 3-D technology turned into a technology development effort as no commercial 3-D scanners could achieve the desired scan fidelity,” says Daniel Hahn, who developed the technology with Kevin Baldwin and Donald Duncan.
In operation, Hahn’s 3-D scanning system acquires the shape, color, and reflectance of objects and renders their characteristics in 3-D graphics format. The data that can then be saved, copied, shared, and manipulated with computer graphics-rendering software. Using the resulting images, users can then specify any viewing direction and lighting condition to best analyze the objects.
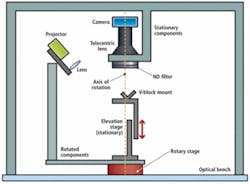
In the design of the prototype scanner, the object to be scanned is first placed in a vertical block that is mounted on top of an elevation stage (see figure). This stage is used to position the object within the focal range of an Lu120 1280 × 1024-pixel USB 2.0 camera module from Lumenera (Ottawa, ON, Canada; www.lumenera.com). Using a 0.25x telecentric lens from Edmund Optics (Barrington, NJ, USA; www.edmundoptics.com), the field of view of each pixel is magnified by a factor of four to 26.8 × 26.8 μm.
These optical components were chosen to optimize the tradeoff between lateral resolution and the scanner’s field of view. Because both object and camera are fixed, image registration is maintained while lighting conditions can be varied by rotating an LP120 digital projector light source from InFocus (Wilsonville, OR, USA; www.infocus.com) about the tablet.
To provide optical data that can be rendered by 3-D graphics software, both color and shape information must be acquired. To accomplish this, color information is obtained by rotating the light source with individual RGB primary colors over twelve 30° azimuthal angles. Shape information is then obtained in two ways. First, the surface of the object is captured using a stereo technique in which a high-resolution surface normal map of the tablet is obtained. This is achieved by illuminating the object with collimated white light and acquiring 12 images at 30° azimuthal increments.
“Although this data is locally accurate, large-scale inaccuracies can occur,” says Hahn. For this reason, a second method using structured lighting is used to generate globally accurate, low-resolution data of the surface height of the object. To accomplish this, four 1-D sinusoidal patterns, each out of phase by 90°, are projected onto the tablet over six 60° increments. Each of the images of different phase is used to determine an absolute phase unaffected by variations in surface reflectance using phase measurement interferometry. Resulting images are then compared to images of a flat white background to calculate the phase difference and corresponding relative tablet height.
When data from the color, stereo, and structured lighting technique are combined, an accurate topology of the tablet can be created. To demonstrate these results, Dean Snyder of Johns Hopkins has developed a Java applet that allows the brightness, specularity, and shading of a 4000-year old cuneiform tablet to be dynamically adjusted (www.jhu.edu/digitalhammurabi/2d+/2d+.html).
Although the original prototype was developed to image cuneiform tablets, a commercialized version of the scanner is now under development by Trilumen (Herndon, VA, USA; www.trilumen.com) to address the forensics and historic preservation markets. After entering into a licensing agreement with the Johns Hopkins University Applied Physics Laboratory in October, the company will also pursue the medical, quality control, and prototyping markets, and has partnered with Direct Dimensions (Owings Mills, MD, USA; www.directdimensions.com) for this purpose.