Vision Software Shines at NIWeek
Andrew Wilson, Editor
Every year in August, thousands flock to Austin to hear about the latest hardware and software from National Instruments. One of the highlights ofNIWeek—apart, of course, from the Mexican food—was the Vision Summit.
During the course of three days, numerous authors presented technical papers that described National Instruments’ (NI’s) latest image-processing software and how developers had leveraged NI’s LabVIEW software to implement specific machine-vision tasks. Two of the most impressive presentations, given by Dinesh Nair and Brent Runnels, discussed the features of these algorithms and how they could be embedded into an FPGA using NI’s reconfigurable I/O (RIO) hardware.
In his presentation, Nair described how functions such as texture defect detection, color segmentation, contour analysis, and optical flow had been implemented in NI’s Vision Development Module, a library of image-processing algorithms and machine-vision functions.
Defect detection
“Scratches, cracks, and stains may vary in size and shape on finished goods with textured surfaces and patterns,” says Nair. “In such applications, traditional techniques such as dynamic thresholding and edge detection are not adequate since it may be difficult to discern these anomalies from the patterned surface.”
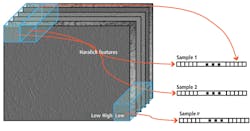
NI has developed a texture defect-detection algorithm that employs discrete wavelet frame decomposition and a statistical approach to characterize visual textures. In this approach, an image is decomposed into several wavelet sub-bands, which are then divided into nonoverlapping windows (see Fig. 1). Next, second-order statistics are calculated by computing co-occurrence matrices from the pixel values within each window.
The generated Haralick features are extracted from all the sub-bands and then concatenated into a high-dimensional feature vector. To learn and classify texture features represented by this vector, a one-classSupport Vector Machine (SVM) is used. This enables the system to be trained to learn “good” texture patterns and identify “bad” ones.
To segment the defects within the image after the system is trained, the texture features must be classified to find areas in an image that do not match the expected texture pattern. A nonoverlapping window is moved across the image to compute and classify features as textures or defects, providing a coarse estimate of defects in the window. Pixels in the defect window are assigned a “1” and others a “0.”
After this, pixels marked as defects in the initial stage are revisited, the texture feature is extracted at each pixel, and the pixel is reclassified as texture or defect. Defects can then be highlighted on the original image.
While NI’s texture defect-detection algorithm is useful in detecting defects of products with textured surface patterns, decomposing images into sub-bands and generating large sparse co-occurrence matrixes are both computationally and memory intensive. Because of this, the software is not suited for high-speed web applications, although according to Nair, parts of the algorithm can be partitioned across multiple processors.
NI’s approach is somewhat similar to supervised image-classification algorithms from companies such as Stemmer Imaging in that SVMs are used (see “New Frontiers in Imaging Software,” Vision Systems Design, June 2010). However, discrete wavelet frame decomposition makes the technique especially useful in finding defects in products with textured surface patterns.
Color segmentation
Image-classification techniques were also used to develop a color classification and segmentation tool, the latter being a new addition to NI’s Vision Development Module. Rather than use a SVM to perform color segmentation, the k-nearest neighbors algorithm (k-NN) generates vectors that describe an object in a feature space. Before this can be accomplished, images must be transformed from RGB to HSI color space.
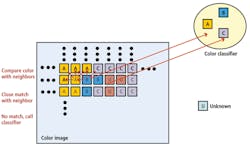
To segment an image into different color regions, a color classifier is first created and trained with all the different colors that appear in the image. Each pixel in the image is then assigned a label either first by its color proximity to already classified neighboring pixels or by classifying the color feature extracted from the pixel by calling the color classifier (see Fig. 2). Should a color value not be determined, it is classified as unknown.
“Of course,” says Nair, “when objects to be separated from the background have very unique colors and are easily specified as a color range, a simpler color thresholding can be used to segment the color images.” Although NI’s Vision Development Module currently does not support multicolor thresholding, this can be done by thresholding individual H, S, and I values.
Contour analysis
Image analysis also plays an important part in the development of the company’s Contour Analysis Tools that allow system developers to more easily extract, analyze, and inspect contours that represent boundaries of objects. This is useful when shape deformities such as chips, burrs, and indents must be detected; when distance and curvature deviations must be determined; and regions of unacceptable differences located, for example.
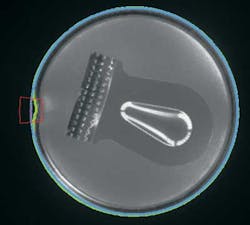
To perform contour analysis, the direction, strength, and connectivity of contours are first computed using edge-detection algorithms such as a Sobel filter. The results are saved in a reference template whose values are used to determine the curvature of the object. This curvature is fitted with an equation that represents a line or a circle, for instance, and the distances from the fitted equation computed. The distances are compared with a reference contour and the curvatures and distances from this reference displayed (see Fig. 3). In this example, a simple LabVIEW program can be used to generate a fit around a can and highlight the dent in the sidewall.
Measuring motion
In the final part of his presentation at NIWeek, Nair discussed how motion vectors can be generated to describe motion in a sequence of images. “By analyzing image sequences,” he says, “such optical flow techniques can be used for object tracking and finding the three-dimensional structure of an object.” A number of different methods can be used, including unsupervised dense optical flow techniques proposed by the teams of Horn and Schunck and Lucas and Kanade, as well as supervised feature tracking methods that use the pyramidal implementations of the Lucas-Kanade filter.
In its optical flow-analysis software, NI opted to implement both techniques. “Unsupervised methods assume that the change in intensity from image to image is due to motion in the scene,” says Nair, and work well on images with details such as texture.
However, they are not accurate in smooth areas and for images where motion is rapid. In these cases, supervised techniques can allow a set of user-specified features such as corner points and texture to be tracked. Readers can view a video of both unsupervised and supervised optical flow tracking athttp://bit.ly/9AoCJD.
Fast primitives
Algorithms for texture defect detection, color segmentation, contour analysis, and optical flow can now be implemented using NI’s Vision Development Module; other, somewhat more primitive operations have been optimized to run on the company’s LabVIEW FPGA module.
“To perform these operations on images as they are captured, developers can configure systems based around the company’s modular PXI-based FlexRIO FPGA board,” says Runnels. When used in conjunction with a ProLight 1101 frame grabber module from AdSys Controls or NI’s own 1483 Camera Link adapter module, Base, Medium, Full, and 80-bit extended Camera Link camera data can be transferred directly to the FPGA on the FlexRIO FPGA board.
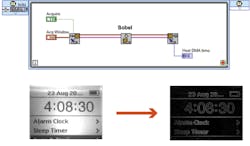
To reduce the need for developers to generate their own VHDL code, NI has provided a number of different sub-Virtual Instruments (sub-VIs) implemented using LabVIEW to speed low-level image-processing functions. These include basic image-acquisition functions that format data from Camera Link ports and DMA FIFO routines to transfer image data to the host CPU. Sub-VIs are also available for LUT-based thresholding, kernel-based filtering operations, and centroid analysis (see Fig. 4).
FIGURE 4. To reduce the need for developers to generate their own VHDL code, NI has provided a number of different sub-VIs such as this Sobel filter to allow the algorithm to be directly implemented on the company’s FlexRIO FPGA board.
Other functions such as image buffering, Bayer decoding, edge detection, grayscale conversion, and image reduction IP are available from LabVIEW FPGA’s IPNet, a collection of FPGA IP from both NI and LabVIEW FPGA developers. According to Runnels, other FPGA-based routines to perform functions such as image calibration are also under development.
Company Info
AdSys Controls, Irvine, CA, USA
National Instruments, Austin, TX, USA
Stemmer Imaging, Puchheim, Germany
Vision Systems Articles Archives
