Vision System Blows the Cover off Powdered Glass
Mark Robinson
Glass manufacturers must ensure that the sheets of glass they make will arrive in perfect condition at their customers' locations. So they apply a thin coating of a powdered mixture comprising spherical polyethylene or polymethyl methacrylate beads and irregularly shaped adipic acid particles to the surface of glass sheets before they are stacked for storage and distribution.
The beads ensure that the sheets of glass do not adhere to or scratch one another; the adipic acid particles guarantee that glass stored in humid warehouse conditions will remain free of stains.
The powder mixture is deposited onto the glass from an electrostatic deposition system that sits above a conveyor, which transports single or multiple sheets of glass. As effective as such systems are, glass manufacturers must ensure that the glass plates along the width and length of the conveyor are evenly coated and obtain the correct mix of bead and acid powder particles.
If the applicators dispense too much powder, manufacturing expenses will increase and may present a hazard for machine operators. Inadequate powder coverage may result in stains or scratches on the glass plates, or plates adhering to one another.
To determine the total number of particles of each type of bead and acid powder, their mass, and density, Inspection Systems has developed a vision-based inspection system that measures the powder coating on the glass and presents statistical data to the plant operator.
Image inspection
To statistically sample the powder on the glass, the vision system does not image the entire length of the glass simultaneously. Instead, sample measurements are taken across the width of the glass as it moves through the conveyor. On a glass line running between 60 and 90 m/min, producing glass plates that are 3 m long and 5 m wide, the vision system typically images 30 different sections of glass across the conveyor. A composite image built from the individual images then provides a measure of the average uniformity and distribution of the powder.
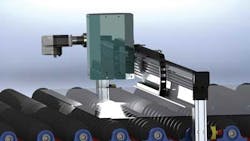
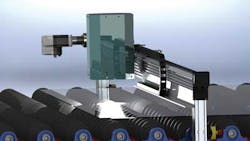
A conveyor carries either a single sheet or a row of several cut sheets of glass plates covered with powder into a vision inspection station (see Fig. 1). As the sheet or sheets of glass travel through the inspection station, two GLV18-6/115/120 optical sensors fromPepperl+Fuchs detect that it is in the field of view of a vertically mounted imaging system.
Once in position, a pilot piA2400 2456 × 2058-pixel area-scan camera fromBasler in the imaging system captures a single square-inch area of the powdered glass as it is being illuminated by four L9455-01 XEF strobes from Hamamatsu mounted in the head of the vision system.
The head of the vision system is then indexed incrementally along a cross-beam across the width of the conveyor by a stepper motor under PC control as the glass moves underneath it. At several positions along its length of travel, images of the single sheet or multiple sheets of glass are captured and transferred to a PC over the camera'sGigE interface.
The system must also accommodate glass of varying thicknesses and degrees of bowing. Since the depth of field of the camera is 1 mm, the system must be taught how to compensate for any bowing effects during system setup and calibration.
To accomplish this, the head of the imaging system features a second stepper motor that is used to adjust the height of the camera. During system setup, the camera is incrementally stepped laterally across a specimen of glass to each of the positions from which images will be captured. The camera is then moved vertically to ensure it is correctly focused on the glass at each of these positions. The lateral position and height of the camera from the glass at these positions is then used to create a so-called focus map.
For a given thickness of glass, the data from the focus map are used in the run-time environment to control the stepper motor, which vertically repositions the camera at the correct height above the glass as it captures images at specific locations across its width. Thus, the system can accurately capture images across the width of the glass, compensating for any bowing effect.
Software solution
To identify glass powder characteristics, Inspection Systems developed custom software using Microsoft's Visual C++ running under Windows 7, eliminating the run-time fees associated with manyoff-the-shelf libraries.
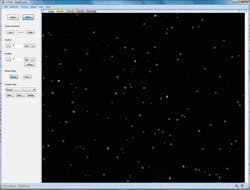
Before the system can be deployed, it must be trained to detect the differences between the beads and the acid in the powder from an image taken of the powdered glass. To do so, the system software performs athreshold operation on each image. This enables bright pixel elements in the image that represent both beads and particles of acid to be identified (see Fig. 2).
To classify the objects, the software makes two calculations: One determines the eccentricity of the objects, and the second performs a template match.
The system determines the eccentricity of the objects in the image because the rounder an object is, the more likely it is to be a bead and the less likely to be an irregularly shaped speck of acid powder.
The eccentricity is calculated as a ratio of the magnitude between the minor axis, or the shortest line segment that intersects the center of the smallest ellipse enclosing the object, and the major axis, the longest line segment that intersects the center of the ellipse. A circle has an eccentricity of 1, while an ellipse has an eccentricity greater than 0 and less than 1.
To determine the differences between particles of spherical polyethylene bead powder and acid powder, the software also takes advantage of the reflective property of the beads. When the polyethylene bead powder is illuminated by the four strobes, the resulting image of any bead powder has four bright areas associated with it, while the speck of acid does not.
However, because the four strobes illuminate each of the polyethylene spheres differently depending on their location on the glass, the brightness and location of these four bright areas may vary slightly. To create an image template that represents a typical bead, multiple images of beads from several positions across the glass are summed to effectively create an average. Then, after the template has been scaled to fit the size of the object, a normalized cross-correlation between the template and the object in the image is performed.
Together with the measure of the roundness ascertained by the eccentricity measure, this average template is used to determine whether or not the powder particles imaged by the system are either round beads or irregularly shaped acid.
The beauty of measuring the eccentricity and performing a template match is that both operations produce results that lie between 0 and 1. Because of that, thresholds for the eccentricity and the template correlation can be set in the system manually during the setup process to give the best classification by eye. At run-time, if the object in the image has an eccentricity and template correlation both greater than their thresholds, then it will be classified by the system as a bead and not as a speck of acid.
In the zone
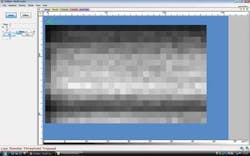
To help glass makers visualize whether an adequate amount of powder is deposited, the system produces a zone map that illustrates graphically how evenly the powder is deposited onto a single glass plate or many glass plates (see Fig. 3).
In addition, the system can ascertain whether or not the correct balance of particle types -- be they acid or bead -- has been deposited across the glass surface by measuring the ratio between the particles that have been identified as beads and those that have not.
The system software can also determine the mass and density of the particles by correlating the data on the particle size and type with the known specification of the powder provided by the powder manufacturer.
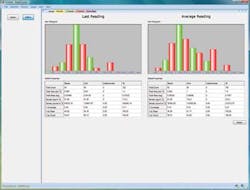
These measurements then enable glass manufacturers to validate that the powder meets any given specification, such as whether the powder has the correct ratio of beads to acid and the size distribution of the particles. All the data can then be displayed on a set of histograms that highlight averages over a run and/or simply the last reading taken (see Fig. 4).
Because it is possible to determine the coverage of powder after it has been deposited onto the glass, glass manufacturers can measure the effectiveness of the electrostatic powder deposition systems upstream in the process. In the future, such vision systems may be employed as part of a closed-loop system to provide direct feedback to powder deposition systems, enabling them to automatically compensate for any inconsistencies in deposition or powder composition without operator intervention.
Mark Robinson is senior engineer at Inspection Systems (Heaton Mersey, Stockport, UK).
Company Info
Basler
www.baslerweb.com
Hamamatsu
www.hamamatsu.com
Inspection Systems
www.inspection-systems.co.uk
Pepperl+Fuchs
www.pepperl-fuchs.com
