Automotive steel belts checked by 3D vision
A laser scan vision system determines the integrity of the spliced joint between sections of continuous belt used in automotive tires.
Dan Hawk
To manufacture the steel reinforced plies commonly used in automotive radial tires, a rubber compound is extruded around brass-coated steel cords through a die or pressed around the cords in a calender mill, a process that forms a strip of reinforced rubber material in which the steel cords run in parallel with the edges of the strip.
However, to create the radial belt material suitable for use in the construction of a radial tire - where the cords run on a bias across the tire - the strip of material must be sequentially indexed into a mechanical bias cutter a specific length at a time depending upon the width of the belt and the angle that it is to be cut. The cut pieces are then spliced together under pressure in the direction of the cutting line to form a continuous belt with the steel cords at an angle to the edges of the belt.
Inspecting the presence and the integrity of the spliced joint between the sections of the continuous belt is of paramount importance, as any deviations from specified tolerances affect the reliability of the finished material. To do so, engineers at Steelastic (Cuyahoga Falls, OH, USA;www.steelastic.com) have developed and deployed a vision system to perform this task. The system can be mounted to the company's own electromechanical bias cutter to ensure that the spliced joints fall within given tolerances after they have been formed.
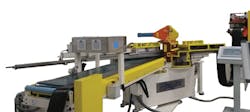
The system employs up to four DS1100 3D laser scan systems from Cognex (Natick, MA, USA;www.cognex.com) depending on the width of material to be inspected (Figure 1). The cameras are mounted above the conveyor on a precision plate on the bias cutter perpendicular to the direction of travel of the finished belt. A three-camera system enables material up to 14in wide to be inspected, while a four-camera system can be deployed to inspect belt up to 20in wide.
Each one of the DS1100 3D laser scan systems incorporates an integrated digital camera and laser stripe illuminator. As a belt is indexed under the sensors, the systems are triggered by a signal from an encoder wheel mounted on the conveyor. Once a trigger has been received, the laser scan systems project a stripe of laser light onto the object under inspection, illuminating its surface. The reflection from the laser illumination is then captured by the imagers in the systems and transferred over a GigE interface to a Cognex VC5 vision controller which creates several 3D profiles of the belt across its entire width.
Belt inspection
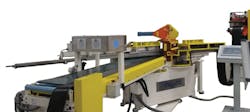
The vision system performs several functions. First, it measures the width of the finished belt and any edge deviation between the joined pieces of material. Known as dog ears, such edge deviations can be caused during the process of aligning the sections of material after the continuous strip of material has been cut and spliced back together in the bias cutter. Alternatively, such dog ears can also be caused by any changes in the width of the strip (Figure 2).
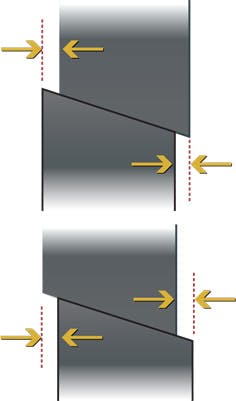
The bias cutter cuts the ends of each strip of material in such a way that each section of material can be effectively joined together with the next to form a half lap joint. The half-lap joint consists of two pieces of material reduced in thickness where they overlap each other. However, in the process of forming such a joint, it is vital that both the mating surfaces are as flush as possible so that the finished steel belt will be of a uniform thickness. To ensure that they are, the vision system measures the splice height between the top surface of the belt on which the strip is conveyed to the top of the splice and the angle of the splice (Figure 3).
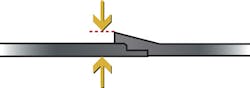
During the process of manufacturing the steel reinforced strip, the rubber material may not be uniformly extruded onto the brass-coated steel cords. If any rubber is missing, one or more of the cords may be visible, or a hole may be present through the strip. Hence, the depth and area of any missing rubber - defects collectively referred to as perforations - must be measured by the vision system. The sensitivity of the system can be set to determine how much rubber is allowed to be missing. The sensitivity percentage is multiplied by the gauge of the strip and a perforation is defined as missing rubber that is below that amount (Figure 4).
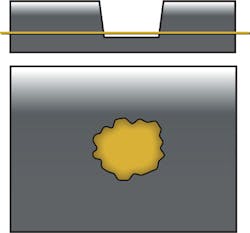
Image processing
Software running on the Cognex VC5 vision controller performs the same inspection operations on each of the images captured by the cameras in the system (Figure 5).
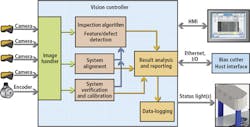
Image handling software ensures that the sequence of images from the four cameras which are captured at any specific instance in the inspection process are processed in parallel threads by the software. The parallel processing guarantees that the vision inspection process time matches the cycle time of the machine. Tools within Cognex' Designer software suite running on the vision controller then detect the pertinent features within the image, while custom built code was written to analyze and display the results on a Human Machine Interface.
Tools from the Cognex Designer toolbox are used in conjunction with Steelastic's proprietary custom algorithms to analyze the product. The first image processing step enhances the images to aid in the location of the edges of the belt. From those measurements, the system determines the specific width of the belt. By analyzing the edges in the images, the system can also determine whether there are any linear deviations in the width that would indicate the presence of a dog ear on both sides of the belt.
Next, the location of the splice is found and measured by evaluating the surface of the belt for height deviations. If a splice can be located, the elevation and the angle of the splice in the belt from the reference surface of the material can then be measured for quality - or to detect whether an open splice is present.
Similarly, a vision subroutine detects the location of any perforations in the material, after which the system can determine the depth and width of any holes. That data can then be analyzed further to determine whether the hole falls within acceptable tolerances.
Alignment and calibration
Aligning the cameras in the system is critical so that accurate results can be delivered from the vision-based measurement system. Because the system can support three or four cameras that can vary in both stand off distance and the angles at which they are pointing down at the conveyor depending upon the product to be inspected, it was also important that the alignment procedure be as simple and as straightforward as possible.
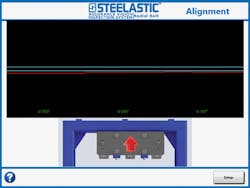
To accomplish this, a custom camera alignment software tool was developed that runs on the Cognex VC5 vision controller. The software tool presents a user with an intuitive alignment window that is used to teach the vision controller where the cameras are positioned, how far they are away from the conveyor belt, and the angle that they are pointing towards the conveyor belt.
The alignment tool is typically only used when the machine is first commissioned, or after any repairs are made to the system once it has been installed on a production line. During the procedure, the cameras are set in a free running mode, rather than triggered by an encoder, and images of the material across its width are captured. As the cameras locate the surface of the conveyor, the software determines how far the surface of the conveyor belt is away from the camera and also the angle of that surface with respect to the camera.
A visualization tool (Figure 6) then alerts the operator as to whether the cameras in the vision system are properly aligned. If they are not, the tool highlights how the cameras must be adjusted to bring them back into alignment by repositioning them at the correct specific height and angles on the precision plate upon which they are mounted.
In order that the software tools running on the VC5 vision controller are accurate while using images from all of the cameras, the system must undergo a verification and calibration procedure. In this process, a precision made test fixture is indexed underneath the cameras.
To verify the accuracy of the system, the cameras capture images of the specific features in the test fixture, such as holes, which are then analyzed using the same algorithms that are used to inspect the finished belt, to ensure accuracy between the two measurements.
A visualization tool then displays the verification results from the measurements from the vision system alongside the actual physical measurements taken from the test fixture (Figure 7). The system also displays the variance between the measured and the actual physical measurement as well as the amount of deviation that would be acceptable for each of the specific defects.
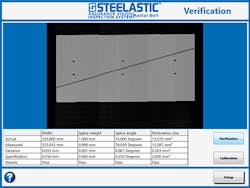
In the event that the verification reports measured values outside of the system specification, it can then be calibrated to ensure accuracy of measurement. Calibrations, like alignments, are normally only necessary upon initial commissioning or in the event that any repairs are made to the system. Verifications can be used as a periodic quality check of the inspection system.
In production
Once the system software tools have analyzed the three or four discrete, overlapping parts of the belt captured by the cameras using the feature and defect detection algorithms during the production of the finished belt, the results from each of them are combined to produce a single set of results that highlight the characteristics of the joint across the entire width of the strip.
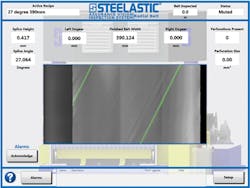
These results are displayed on the HMI where an operator can view the image of the entire belt as well as the location of the joins on it. The HMI also displays the results from the image analysis of the belt, highlighting key features such as the width of the finished belt, the size of the right and left dog ear, the splice height and angle as well as the number of perforations that are present and their size (Figure 8).
Although the system has been designed to work with Steelastic's own bias cutter, the developers have provided an I/O interface to enable the system to interface to machines from other bias cutters manufacturers as well. Through the interface, the vision system can inform the bias cutter when any defects occurred that fell outside the specified inspection parameters and stop the production process so that an operator can repair the specific section of finished belt and then allow the system to continue operation.
By Dan Hawk, P.E., Electrical Controls Engineer, Steelastic (Cuyahoga Falls, OH, USA; www.steelastic.com).
Companies mentioned
Cognex
Natick, MA, USA
www.cognex.com
Steelastic
Cuyahoga Falls, OH, USA
www.steelastic.com