Vision system classifies wood into species
A vision system has been deployed in a Canadian lumber mill to sort boards of Spruce-Pine-Fir lumber.
Skye Gorter
In North America, Spruce-Pine-Fir lumber is the construction method of choice for many single-family homes due to its competitive cost, strength, light weight, and ease of cutting and nailing. Spruce-Pine-Fir - or SPF - lumber is a group consisting of four species of Canadian trees: White Spruce, Engelmann Spruce, Lodgepole Pine and Alpine Fir. Since the species share similar characteristics, they are traded jointly in the market and hence the collective term SPF is commonly used to describe them.
Varying lengths of SPF boards that meet a set of commonly accepted dimensions are produced in large lumber mills in North America from felled trees. The boards are sold in a variety of different dimensions ranging from a nominal size of 2 x 3ins to 2 x 12ins and lengths from 6ft to 16ft.
To manufacture the boards, trees with their limbs removed are conveyed into lumber mills where the outer barks of the logs are removed with sharp-toothed grinding wheels, while the logs are rotated about their long axis.
Once completed, the logs are then cut into sections of predetermined lengths by means of a circular bucking saw.
Laser scanning
Prior to cutting into boards, however, the log is first dimensioned by a laser-line scanner system to determine its diameter at each end, its length and any visible defects. The log profile data acquired from the imaging process is used to calculate how the log should be cut to optimize the number of boards that can be produced.
To do so, a computer calculates a cutting pattern from 3D data to maximize the length and sides of boards obtainable from the log. The log is then fed lengthwise through a vertical band saw which then cuts it into the desired lengths based on the profile information. Once the lumber has been cut into specific lengths, the conveyor indexes the boards into an inspection station. Here, an operator individually grades the lumber based on any defects - such as rot, cracks, and fungal damage - that are visible in the wood.
To do so, the operator physically makes a mark on the wood which classifies the type of defect and its location on the board. Once the defect has been manually identified, the board is then conveyed through a vision station that identifies the mark. The data from this vision station is then fed to a set of computer controlled saw blades which cut out the defects in the board based upon the identifying mark on the wood, producing shorter lengths of lumber in the process.
As lumber mills can process both spruce and fir, it is important that boards from each species are identified be identified prior to being dried in a kiln. Faced with this challenge, the management at one large Canadian lumber mill approached engineers at Skye Automation (Stirling, ON, Canada; http://skyeautomation.ca) to develop a custom vision system to perform the task.
Vision inspection
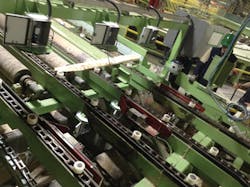
The vision system developed by Skye Automation comprises a set of seven 1.2MPixel GigE cameras from Baumer (Radeberg, Germany; www.baumer.com) interfaced to an integrated PC from Lenze (Hamelin, Germany; www.lenze.com). While three of the cameras capture images of the top surface of the board, three capture images of its underside. The final camera captures an image of the cut end of the board (Figure 1). Top and bottom wood surfaces are illuminated by ring lights from DCM Sistemes (Valencia, Spain; www.dcmsistemes.com) while the end of the board is illuminated by a bar light. Once captured, data from the cameras is transferred to the PC and processed by Vision Q.400 system software from Q.Vitec (Ottering, Germany; www.qvitec.de).
The cameras play a collaborative role in capturing images that are used to identify the species of lumber by determining its color and water content. The image captured of the side of the board, for example, is first processed to identify the location of the annular growth rings on the surface of the wood. The orientation of these growth rings provides an indication of which side of the board would be closest to the pith - or the heart of the tree - which was present in the first year of growth.
If the result of the image analysis determines that the pith would have been above the board, then the images captured from the three cameras mounted above the board are used as the primary indicators of species along its length. If the software determines that the pith would have been below the board, then the images captured from the three cameras facing upwards are used as the primary indicators of species of the underside of the board.
Growth rings
Determining the prior location of the heart of the tree relative to the rings on the end of the board is an important first step in the processing chain. This is because the images captured of the surface of the board with the rings facing towards the cameras provide information that can be analyzed to clarify the wood's color and water content - two important indicators that determine whether the board has been produced from a spruce or a fir.
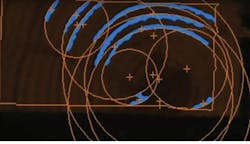
Once a side view image of the board has been captured, a feature extraction operation is performed on the image to determine the precise location of the end of the board. From this, a patented "object shape" tool dynamically adjusts a region of interest (ROI) at the end of the board. A second feature extraction tool is then employed to identify the location of the growth rings. This is achieved by analyzing all the RGB color channels in the image and then using the most prominent color channel in the image from which to determine the variance in the contrast in the image across a specific region.
From finding the partial circumferences of one or more of the growth rings, the software can then compare the projected center of the growth ring with that of the location of the top of the board to determine the orientation of the growth rings (Figure 2).
Color and contrast
All seven cameras are triggered and all of the images are used for determining species for every board. However, the captured images that represent the "pith" side of the tree are used or weighted more heavily in the outcome of the species identification.
The images from the top and bottom cameras are transferred to the PC where the system software analyzes the images to determine both the color of the board and its water content, which can both vary markedly depending on the species of tree from which the lumber was cut (Figure 3).
Because the color of the wood varies between different species of trees, the color of the wood - which can range from white to light yellow in color - can help identify the species. So too can determining the water content, which can be as high as 70% in a fir or only about 30% in a spruce.
To determine the color of the board, the image processing software locates features of interest in the images where the board is present. The software then measures the RGB values from those features captured by the cameras over the length of the board, and performs an averaging operation to ascertain the average color of the board in RGB space.
The amount of water content of the board will have a marked effect on color contrast. Hence to determine the water content, the images of the board are analyzed to determine the color contrast in the images of each of the three RGB channels.
The difference in the color and brightness of features and other objects within the same field of view are used to provide a measure of the contrast of the red, green and blue colors across the board. The average contrast found by combining the results for the analysis of all three images then provides a measure of the water content of the board.
Board sorting
Once the color and contrast variance values have been calculated, they are compared to a table of values that indicates acceptable tolerances ranges that are used to classify the board as either a fir or a spruce. In either instance, the result is then transferred over an RS-232 interface to a PLC that instructs the conveyor system to drop the boards into one of two sets of bins, depending upon how it has been classified (Figure 4).
The sorting of the wood by species is critical to ensure that the boards are dried in the appropriate fashion prior to shipment. Once sorted, the boards are stacked prior to being dried in a kiln which circulates heated air to rapidly reduce the moisture content of the wood. The process ensures that the final moisture content level for each species of wood are even to eliminate any future problems such as warping and twisting.
To date, the vision-based inspection system has played an important role in ensuring that boards cut from each species of wood are identified and then dried correctly. Since it was installed, the system has achieved an accuracy of over 90%. In the future, the system will be upgraded and it is hoped that 95% accuracy will eventually be achieved.
Skye Gorter, President, Skye Automation, Stirling, ON, Canada (http://skyeautomation.ca)
Companies mentioned
Baumer
Radeberg, Germany
www.baumer.com
DCM Sistemes
Valencia, Spain
www.dcmsistemes.com
Lenze
Hamelin, Germany
www.lenze.com
Skye Automation
Stirling, ON, Canada
http://skyeautomation.ca
Q.Vitec
Ottering, Germany
www.qvitec.de


