Applying volumetric image rendering for medical data sets
Applying volumetric image rendering for medical data sets
By John Haystead, Contributing Editor
Without setting foot in an operating room, physicians and clinicians can conduct detailed, endoscopic-quality diagnostic examinations of a patient`s internal organs and tissues, including regions that would not otherwise be accessible through traditional mechanical bone and vascularture endoscopy. Known as perspective volume rendering (PVR), this noninvasive software-based technique accurately simulates endoscopic imagery using image data collected from computed-tomography (CT) and magnetic-resonance (MR) scanners.
Hosted on Silicon Graphics (Mountain View, CA) SG-02 workstations, Vital Images (Minneapolis, MN) Vitrea medical visualization software renders both two-dimensional (2-D) and three-dimensional (3-D) volumetric images, allowing clinicians to navigate or interactively "fly through" 3-D space to evaluate clinical radiology and to plan surgery if needed. Vital Images developed the Vitrea software simultaneously with the development of the SG-02 platform, as part of a collaborative relationship with Silicon Graphics. The imaging system uses an SG-O2 workstation with an R5000SC or R1000SC central processing unit (CPU), a 4-Gbyte hard drive, and a 512-Mbyte RAM.
Imaging on call
By allowing physicians to better visualize patient anatomy and pathology prior to and after surgery, the Vitrea software tool helps reduce surgical and radiological costs and improves care quality. According to Dr. J. Pablo Villablanca, assistant professor of neuroradiology at the UCLA Medical Center (Los Angeles, CA), the imaging system has "added tremendous value" to the facility`s clinical radiology and surgical planning processes. UCLA participated in beta-testing the Vitrea 1.1 software and has been using the system on a routine basis for nearly a year in both clinical examinations and basic research work. The medical center currently has two workstations, but Villablanca says they plan to expand their capabilities. "Demand for the service is really going up. It`s no longer an experimental capability; it`s clinically helping patients today," he adds.
UCLA is also using the system to evaluate patients with intracranial aneurysms, particularly those whose vascular pathology cannot be fully understood using traditional diagnostic tools such as cerebral angiography. Because multiple procedures are available to treat such conditions, ranging from classic neurosurgery to subcutaneous treatment via a catheter passed through the femoral artery, physicians must obtain prior critical and precise information about the size, nature, and location of the aneurysm and of the surrounding vascular tissue.
As described by Villablanca, the inherent projectional limitations of cerebral-angiography procedures limit the number of perspectives possible of the intracranial arteries, whereas there are no such limitations with the 3-D volume reconstruction of data collected through spiral computerized tomographic angiography (CTA). Says Villablanca, "We can rotate and manipulate the data as we please, giving us the information we need to make the best possible choice of treatment."
Similarly, patients with intracranial stenosis (narrowing of the blood vessels) are traditionally diagnosed using magnetic resonance angiography (MRA), but, as pointed out by Villablanca, MRA highlights only an area of reduced blood-flow signal, without clearly defining the extent of vessel narrowing. High-resolution volume renderings of spiral CTA data, on the other hand, can provide quantitative analysis of the extent of the stenosis. "This is critical information because it allows physicians to better evaluate how aggressive they should be in applying potentially risky blood-thinning therapy," says Villablanca.
Slices serve data
Most modern spiral CT and MRI systems are able to acquire volumetric data sets with nearly isotropic (axis-independent) voxel (3-D pixel) values. Therefore, a surface or anatomic feature with sufficient contrast can be clearly imaged in multiple dimensions. In CT, contrast is determined from variations in signal attenuation; in MRI, signal-intensity differences are measured.
As described by Kathy Guetzlaff, Vital Images director of engineering, volume-rendering techniques allow the data from all the voxels within a given volume to be compiled without information loss. To create the volumetric images, an 8-bit histogram range of intensity values is first generated from the individual sections or "slices" of unprocessed 12-bit CT or MRI data. This range contains all the voxels of relevance to the examination. Typical CT images are 512 ¥ 512 ¥ 12 bits, whereas MR images are 256 ¥ 256 ¥ 12 bits.
For MR data sets, the resultant histogram range is inherently less than 8 bits, but for CT data, the histograms must be further truncated and compressed prior to processing. For example, the high or low end of the histogram is truncated where the structures associated with particular data points are not of interest to the clinician. Then, any remaining histogram ranges above the 8-bit threshold are further compressed. To represent lighting, contrast, and shading effects, an additional 8 bits of gradient information are assigned to each voxel. The data set is then loaded into system memory. A typical processed data set runs between 100 to 200 Mbytes.
After memory loading, each voxel is automatically assigned a color and opacity value based on factors such as intensity and magnitude of the spatial gradient. In CT, these voxel values are analogous to Hounsfield units; in MR imaging, they coincide with signal intensity. The coloring is chosen to simulate expected normal tissue color and to differentiate anatomical structures.
The Vitrea Image Gallery tool can display as many as six independent 2-D and 3-D views of selected image data optimized for the particular clinical process via automated protocols. At the same time, the imaging system automatically reads and displays demographic and scanner information such as patient identification, study name, series, date, and modality. Using the "query/ retrieve" feature, an entire data set or a subset of contiguous slices can be displayed.
The protocols can be automatically preselected based on the type of examination indicated by the digital-imaging and communications-in-medicine (DICOM) header fields attached to the CT or MRI data; DICOM is the medical industry`s standard scanning format for exchanging information. Implementing network communications based on DICOM and Internet protocols improves communications between clinicians and patients, and allows information to be more easily shared among health-care institutions, offices, and homes.
The Vitrea "Viewer" tool can display images in several different visualization environments for detailed examination, including a user-selectable montage of 1, 4, 9, or 16 2-D slices; 3-D multiplanar reformatted; or enlarged, full-screen 3-D volume views in which the clinician can interactively navigate, pan, cine zoom, and annotate.
Virtual endoscopy
After a PVR data set is compiled, clinicians can also use the Vitrea system`s navigation mode to scan through a series of images or "fly through and around" the virtual volumetric space. In navigation mode, image generation rates range from two to ten frames per second depending on the size and complexity of the data set and the viewing option selected. In a typical application, the Vitrea system renders images at 10 to 20 million voxels/s for full-resolution volume rendering and 8 frames/s during interactive volume manipulation.
The clinician`s viewing perspective is represented by either a fixed or variable field-of-view "virtual camera." The camera`s position and direction along the flight path are defined by three Cartesian spatial coordinates and three directional coordinates linked to individual tomographic sections. According to Villablanca, total clinical analysis can usually be done in about 20 minutes. "In less than an hour`s time from scan to end, we have information that can make a difference in how well a patient`s care will be managed," he says.
In June, Vital Images released a new version of the Vitrea software. According to Guetzlaff, whereas earlier versions of the software were geared more toward the research community, the current system was optimized for hands-on clinical use. "The automatic protocols were designed to apply the most efficient algorithms and parameters to best suit a particular data set type. For example, one protocol can highlight the Circle of Willis (the system of arteries that conducts blood to the brain) in a certain data set. This allows users to obtain meaningful images without having to spend a lot of time formatting and adjusting their image quality," she adds.
Other new imaging capabilities include a semiautomatic segmentation feature that allows physicians to isolate and remove parts of the anatomy that they don`t wish to view.
Additional features allow physicians to view MPR planes at any oblique angle in addition to orthogonal views. The Vitrea 1.1 release also allows faster, higher-resolution automatic navigation and adds further dedicated visualization protocols to increase the number of DICOM-qualified scanners, servers, and printers that can be used with the system.
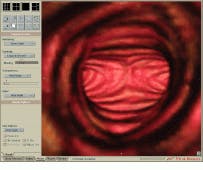
FIGURE 1. A simulated endoscopic view of the trachea and bronchus shows the carina (keel-like ridge) and the origin of the left and right mainstem bronchi. This image was produced in real time with no preprocessing.
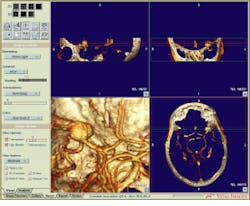
FIGURE 2. The Vitrea Viewer is the primary screen used by clinicians to view and interact with the two-dimensional and three-dimensional image data of a patient. This image is a 3-D volume view of CT-derived Circle of Willis with an aneurysm visible in upper left quadrant.
FIGURE 3. With the Vitrea Viewer, clinicians can simultaneously view 3-D volume-rendered projections, correlated multiplanar reformatted 2-D slice views, and a 2-D slice display in 1-, 4-, 9-, or 16-slice formats.
FIGURE 4. Simulated endoscopic view of computed-tomography-derived data shows an upper cervical spine from Foramen Magnum (the large opening in the base of the skull through which the spinal cord merges with the brain).


