Moiré interferometry spots windshield defects
By C. G. Masi, Contributing Editor
Moiré metrology quantifies optical distortions of curved automobile glass windshields during automated testing to maximize production yields.
Sleek, aerodynamic automobile body styles are now possible because glassmakers have learned to precisely bend safety glass. Automotive designers can specify compound curves and extreme slopes for windshields, side lights, and rear windows because they are confident that their suppliers' glass-making processes are capable of producing these difficult window pieces while maintaining superb optical quality.
Keeping variations in these processes under control requires inspectors to measure variations in glass shapes smaller than the wavelength of light. Minute variations in the shape of a glass surface (known as its figure) can form lens-like zones that magnify or demagnify portions of a scene viewed through the glass pane and cause visible distortion and difficulty focusing on distant objects.

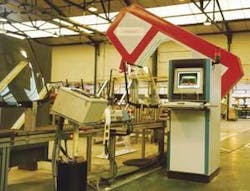
To help ensure the quality of these glass components, ISRA Vision Systems/Glass Vision Business Unit (formerly Innomess [Lansing, MI], a subsidiary of ISRA Vision Vision Systems [Darmstadt, Germany]) has developed an advanced glass-inspection method, called ScreenScan-Faultfinder, based on the moiré effect. Manufacturers of automotive glass products are adopting this technology because it provides considerably higher measurement precision to uncover glass thickness variations than was previously possible (see Fig. 1).
Special problems
It is not so much the glass thickness variations that cause problems, but their spatial frequency and tilt angle, as well. Distortion arises from the difference in curvature of the two glass surfaces exacerbated by the windshield's slope. For a given Fourier spatial-frequency component, the curvature introduced by a variation changes with the variation's amplitude times the square of its spatial frequency times a tilt factor, which increases exponentially with the angle between the glass pane and the light ray going through it.
A laminated windshield, for example, consists of two glass plates with a polyvinylbutyl interlayer sandwiched between them. This interlayer is a tough elastomeric polymer that resists ripping and cutting should the glass be shattered. In laminated safety glass, four surfaces must be shaped and evaluated: the windshield outside surface, the bonding interface between the outer glass sheet and the interlayer, the bonding interface between the interlayer and the inner glass sheet, and the inner surface of the inner glass sheet.
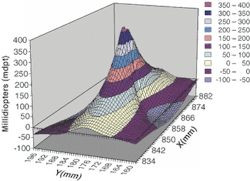
For a glass windshield to be rejected, distortions must be so severe that they cause safety issues. Drivers and passengers expect the windows in a car to be effectively invisible. They find discernible optical distortions annoying and, therefore, unacceptable. These distortions produce two basic symmetries-spherical and cylindrical-that are named for the lens types having those symmetries. Spherical (also called "bull's-eye") distortions form in roughly circular zones that are thicker (positive magnification is measured in diopters) or thinner (negative magnification) than the surrounding glass. Cylindrical (also called "line" or "stripe") distortions appear in bands that are thicker or thinner than the surrounding glass. Generally, optical-distortion zones include a mixture of spherical and cylindrical distortions (see Fig. 2).
Portions of a scene viewed through a positive spherical zone look both larger and closer than normal; negative zones present the opposite effect. Viewing an object through a positive horizontal cylindrical zone appears to stretch the object vertically, but not horizontally. Even worse, cylindrical zones introduce astigmatism, which makes it difficult for the viewer's eyes to find a sharp focus.
Thickness variations are not the only manufacturing variations that can cause optical distortions in automotive windshields. Glass is a mixture of silicon dioxide and various impurities. Variations in the impurity content from place to place within a glass piece can have the same optical effect as thickness variations. A zone whose stoichiometry gives it, say, a slightly higher refractive index than the surrounding glass can create exactly the same distortion as a slight thickening in the glass. The distortions that these two mechanisms produce are, in fact, indistinguishable by optical means
Past efforts to measure distortions from variations in glass thickness have used the shadow of a grid projected through the glass. In this method, a machine-vision camera views a precisely ruled grid through the window under test. Thickness variations distort the grid's image falling on the camera's focal plane. These distortions displace the grid-line images from their nominal position. As long as the displacements are larger than a substantial fraction of the pixel size, the vision system can detect them. Unfortunately, these shadowgraph displacements are a first-order effect. That is, displacement is directly proportional to the distortion. The precision, which is limited to the order of a pixel size, is not sufficient to find subtle annoying defects.
Camera pixelation
The ScreenScan-Faultfinder system uses the pixelation of a linescan camera's CCD array as the detection grid and a physical grid for a reference. To avoid instrument artifacts, the optical system must produce a flat reference-grid image on the camera's focal-plane array. In addition, the magnification must be set so that the reference-grid image has the same spatial frequency as the CCD array.
A calibration algorithm automatically adjusts the camera's magnification and position so that light passing through the reference grid spaces falls between the CCD pixels in the absence of glass-under-test (GUT) distortion (see Fig. 3). This scheme provides a uniformly dark background. The GUT distortions locally magnify or demagnify the reference-grid image falling on the CCD. Slight positive distortions make the image larger (lowering the spatial frequency), and negative distortions make the spatial frequency higher. Both effects create bright fringes on the dark background, whose spacing reflects the distortion's magnitude. More severe distortions create more closely spaced fringes.
The moiré effect is a well-known technique for determining the figures of glass surfaces (see "Moiré effects," below). The ScreenScan-Faultfinder system combines the optical moiré technique with machine vision and high-speed image analysis; then, it automates and scales up the system up to inspect full-size automotive windshields at production-line rates.
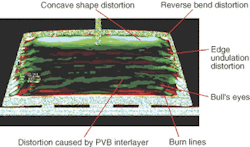
Instead of displaying black-and-white images of intensity fringes, the vision system interprets the moiré pattern as a defect map (see Fig. 4). Each defect has a unique appearance on this display. Unlike the older shadowgraph method, the vision system's moiré technique possesses enough sensitivity to quantify defects even below the level at which they become noticeable to car drivers. This opens the possibility of making pass/fail decisions automatically. A supervisor would use program-selection criteria based on defect zone size and maximum local magnification.
Additional capabilities include uploading the quantitative data to higher-level process-automation systems such as statistical process control. By combining the moiré technique's sensitivity with machine-vision flexibility and automation, the system has raised the bar for state-of-the-art automotive-glass manufacturing technology.
Moiré effects
Moiré interferometry is a precise measuring method. The odd-curved bands that you see when looking through the folds of a sheer window curtain, for example, are moiré fringes. Such patterns appear whenever a light beam passes through two regularly spaced grids having slightly different spacing.
To demonstrate the moiré effect, a light beam is directed at a reference grid (see figure). Then it passes through the glass under test (GUT). Finally, it passes through the detection grid. If the GUT introduces no distortion and the grids have identical spacing, the beam exiting the detection grid is uniformly gray; that is, some light is blocked, but the fraction that is blocked does not vary across the beam.
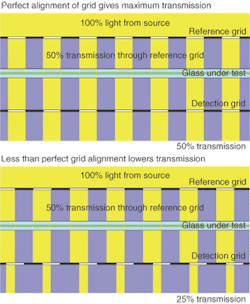
Assuming that the dark stripes in each grid are the same width as the spaces between them, the first grid will block half the light. If the reference and detection grids line up perfectly so that the shadows from the reference grid fall on the detection grid's dark bands, no further light is blocked. The sandwich looks like a uniformly 50% gray filter to a camera that cannot resolve individual stripes.
If the registration is not perfect, the detection grid blocks some of the light passing through the reference grid. The sandwich then looks darker-but still uniform. In this scenario, the transmission varies from 50% to 0%, with 25% being the value when the detection grid is out of place by one-half of the bandwidth.
Consider that the detection grid spacing is slightly larger or smaller than that of the reference grid. There is no way that the two grids can line up perfectly over their entire widths. If they line up perfectly at one point, they must become progressively more misaligned the farther they move from that perfectly aligned position.
Take, for example, a detection grid with a spacing 1% smaller than that of the reference grid. If you line them up perfectly at one spot (so you see a maximum of 49% transmission there), then, at the point 50 linewidths to one side, the stripes will be perfectly misaligned. The transmission there will be 1%. Moving another 50 stripe widths brings you to a spot where the misalignment is exactly one stripe width. Since one stripe is the same as another, registration is again perfect, and the transmission goes back up to 49%. The pattern continues as you move across the beam.
Therefore, a camera that cannot resolve the individual stripes sees, instead, a series of light and dark fringes-the moiré pattern. The spacing between the fringes depends inversely on the relative spatial frequencies of the two grids. In the described example, the detection grid spatial frequency is 1% higher than that of the reference grid; then the moiré fringes will appear 100 reference-grid wavelengths apart.
REFERENCES
O. Kafri and I. Glatt, The Physics of Moiré Metrology, John Wiley & Sons, New York, NY (1990).
D. Malacara, Optical Shop Testing, 2nd ed., John Wiley & Sons, New York, NY (1992).