Microscopy tracks microtubule changes
In the search for new anticancer drugs, researchers have turned to electron-multiplying CCD camera systems.
By R. Winn Hardin, Contributing Editor
Microtubules are dynamic protein polymers that run from the center of a biological cell to the outer cell wall. They are important to many cellular functions, including growth, division, motility, and signaling, and, in particular, they act as key regulators for cells. Controlling the turnover or growth of microtubules can help keep disease in check when something goes wrong, such as massive proliferation or dysfunction of the cell cycle in cancer. As a result, pharmaceutical companies are developing drugs, such as Paclitaxel, which interrupt the growth of microtubules.

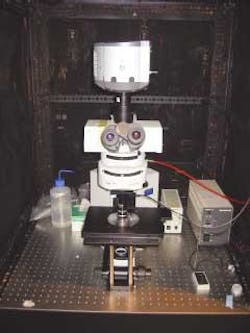
Associate research scientists Derek Toomre and Stathis Hadjidemetriou at the Yale University Cellular Imaging Using New Microscopy Approaches (CINEMA) Laboratory hope to further the understanding of microtubule dynamics and drugs such as Paclitaxel. They have developed an automated imaging system that eliminates the need to manually annotate video sequences while allowing scientists to observe cellular interaction for longer periods of time than previously possible. The Yale system for fluorescence microscopy uses an Olympus BX51 research epifluorescence microscope, TILL Photonics monochromator light source, and Andor iXON electron-multiplying (EM) CCD camera and image-acquisition board with custom software developed in MathWorks MatLab (see Fig. 1).
Trouble with fluorescence
Imaging specific proteins in dead (fixed) cells and tissue has been possible since the 1970s using a technique call immunofluorescence. Only in the last decade, however, with genetically encoded fluorescent tags, such as green fluorescent protein, have scientists been able to easily track protein dynamics in live cells, including their organelles and molecules. Some scientists still label molecules with a dye and poke these into cells (microinjection), but this is an arduous process.
Green fluorescent protein is a bright fluorescent tag and is relatively long-lived, but like all fluorescent tags it photobleaches, or loses its ability to fluoresce under extended exposure to the excitation wavelength. As a result, scientists have two choices: bombard the fluorescent tag with intense light and view intense fluorescence, which provides a high signal-to-noise ratio for short periods of time, or use sensitive cameras at lower excitation powers (producing less fluorescence) for longer periods of time, and thereby collect more data for analysis.
Toomre says he has evaluated many microscope cameras for use in his experiments, and there are three choices: "You can use standard CCD cameras, intensified cameras, or the new electron-multiplying cameras. Standard CCD cameras are limited in their sensitivity. Intensified cameras can produce blooming effects when one pixel is very bright in comparison to its surroundings. EM cameras avoid that blooming while providing excellent sensitivity with less noise."
The digital Andor iXON EM camera uses a Marconi 512 × 512-pixel CCD sensor similar to the Roper Scientific Photometrics Cascade camera; however, the iXON uses a stack of five Peltier coolers to cool the sensor down to ±90°C. This essentially eliminates the dark-current noise, leaving only the clock-generated random noise common to all cameras.
The iXON comes with proprietary cable and an image-acquisition card that fits in Toomre's Dell Precision workstation. The workstation includes dual Xenon 2-GHz processors, 1 Gbyte RAM, and 300 Gbytes of hard disk space in addition to standard Ethernet, video card, monitor, and DVD RW and CD RW drives. "One thing you definitely need with this system is a lot of RAM to hold all the pictures and be able to display things quickly. The hard-disk space fills up quickly, too. The workstation is hooked up to the laboratory local-area network, but we just as often burn the data to DVD or CD for sharing or storage.
Wavelength excitation
Illumination is provided by a stand-alone system that is separate from the rest of the imaging system. The TILL Photonics Polychromator 4 monochromator contains its own Xenon short-arc-lamp light source and comes with a remote-control pendant for controlling the system. The monochromator uses a galvanometric-scanner-mounted grating and mirror optics to deliver 6 to 8 mW of illumination in 15-nm bandwidths through a solid quartz fiber. This quartz fiber is connected to a TILL Photonics epifluorescence condenser in the Olympus BX51 microscope. "TILL Photonics is widely used in microscopy and can switch wavelengths in 2 ms," Toomre says.
Toomre chose the Olympus microscope for several reasons, including its special objectives. Olympus manufactures a low-magnification (20X), high-numerical-aperture (0.95 NA) water-immersion objective that, when combined with a 2X extension, reduces optical distortion at relatively high magnification while providing a long working distance (see Fig. 2).

After a slide is placed on the microscope, Toomre triggers the Polychromator 4 through the control pendant and the iXON camera via the Andor-supplied control software running on the Precision workstation. The Andor software is mainly for image acquisition and viewing, labeling, and storing images—typically in TIF format—and controlling the camera settings such as frame rate and length of a recorded sequence.
A standard experiment begins with acquiring a series of images of a tissue sample. An anticancer drug is added to a similar sample and a second series of images are taken. Proprietary software then compares the growth rates of the microtubules and determines how the drug has affected microtubule growth.
Structural web
After the series of images are stored in TIF format, software written by Hadjidemetriou takes over to automatically quantify the growth (or lack of growth if a cancer drug is involved) and movement of the fluorescently tagged protein polymers that make up the microtubule. Microtubules grow in curved paths between organelles near the cell's nucleus and the cellular wall, transporting proteins, peptides, and other materials necessary for cellular health. They can appear as spider webs, never touching in 3-D space but occluding each other in a 2-D image of the cellular environment (see Fig. 3).

The software is designed to preprocess the image to eliminate noise, locate the microtubule, and monitor the changes in size and location that may occur during the sequence as a result of anticancer drugs or other chemicals injected into the cell. During preprocessing, the software takes an elliptical filter element that bears the general shape of a microtubule and compares it to the image by rotating the filter through 20 different orientations in relation to the image (see Fig. 4).

The filter is designed so that the sum of the filter values is always zero. As the filter under various orientations is correlated to the image, image noise has little effect, resulting in a filter output that is close to zero. If there is a microtubule of certain orientation, the filter of that orientation will give a high response because the central part of the filter is positive.
To identify the position and shape of an individual microtubule in a single frame, the software analyzes a closed band in the general shape of and located near the cellular wall. To determine the band's location, and therefore the starting point for the search, the software fits a sum of Gaussian distributions to the image, selects a certain distance from the center of the Gaussian distribution, and then creates the band. Subsequently, the software searches inward from the band for pixels that exceed a user-set intensity value. The first pixel identified near the outer wall of the cell is identified as the beginning of a microtubule. Each microtubule is grown pixel by pixel from each starting point.
"At each iteration, we move in the direction in which the image has higher intensity. If the program has a choice, it prefers directions that make the microtubule smooth with low curvature. It represents the microtubule by a series of points. It stops the iteration when it exceeds a certain number of iterations, or when tracking reaches the background of zero intensity," Hadjidemetriou explains.
The resulting stack of data points is then compared to stacks on subsequent images to determine the length, growth rate (polymerization), or reduction rate (depolymerization) of the microtubule. This quantitative information directly relates to how the drug or chemical introduced into the cell affected microtubule growth, and therefore, could slow the growth of cancer and other diseases.
According to Toomre, the system as developed works well, but he looks forward to adapting the system to more advanced microscopes such as the PerkinElmer spinning-disk confocal microscope, which would provide greater control of the excitation illumination and provide longer video clips to analyze and add the third dimension (height) to the 2-D images collected so far. Before that can happen, Andor needs to work with other equipment vendors to create drivers so that the microscope, camera, and illumination source can be adequately synchronized, says Toomre.
features, advantanges, benefits

Electron-multiplying cameras hold promise for imaging molecules in living cells andin vitro. They are currently competing with intensified-CCD cameras and should grow in use, especially as new chips that are both faster and have smaller pixels are developed. What appears to be the current limitation is clock-induced noise. Yale University associate research scientist Derek Toomre says that the iXON EM camera performs better than other cameras he has tried for these applications, mainly because its low vacuum and five Peltier devices cool the sensor down to ±90°C, which is an excellent level for investigations into intracellular structures such as microtubules.
Tomre says, "In terms of image detection of microtubules or other cellular objects, such custom software can be tricky to get right. It's amazing just how good our brains are at image and motion detection, even of faint blurry objects. The challenge here is to 'teach' a computer to do the same thing. On the other hand the computer can rapidly process and accurately store enormous amounts of data, and this sort of analysis is what is needed, especially as areas such as high-throughput screening of cells are increasingly become part of pharmaceutical companies' new toolbox."
Company Info
Andor Technology, South Windsor, CT, USA, www.andor-tech.com
Dell Systems, Austin, TX, USA, www.dell.com
Marconi Applied Technologies, Bievres, France, www.marconi.com
Olympus America, Melville, NY, USA, www.olympusamerica.com
PerkinElmer Optoelectronic Systems, Fremont, CA, USA , www.perkinelmer.com
Roper Scientific, Tuscon, AZ, USA, www.roperscientific.com
The MathWorks, Natick, MA, USA, www.mathworks.com
TILL Photonics, Gräfelfing, Germany, www.till-photonics.com