Software assesses fishing quotas
To replenish heavily exploited commercial fish stocks, fishery scientists need to forecast the recruitment of new stock in relation to the standing stock of fish. It is possible to assess egg production of the fish population, but many fish have to be sampled and millions of eggs counted. Doing so leads to a better understanding of the recruitment process. The analysis must be completed quickly to provide up-to-date information.
Working in partnership with the Centre for Environment, Fisheries and Aquaculture Science (CEFAS, Lowestoft, UK; www.cefas.co.uk), John Pilkington of Pilkington Scientific Imaging (Haywards Heath, UK) has developed a system that accelerates data collection by partially automating measurement routines. To image the samples, Pilkington and his colleagues mounted a TMC 1000 CL Camera Link camera from Pulnix (Sunnyvale, CA, USA; www.pulnix.com) to a SZX12 stereomicroscope with cold light source from Olympus (Melville, NY, USA; www.olympusamerica.com).
After images are digitized using a Meteor II CL Camera Link frame grabber from Matrox Imaging (Dorval, QC, Canada; www.matrox.com/imaging), they are processed using the Aphelion image-analysis-development environment from ADCIS (Herouville-Saint-Clair, France; www.aai.com). "This prototyping package allowed image data to be exported to stand-alone programs such as Microsoft Excel with an application-specific interface using the Aphelion Active X controls," says Pilkington.
"The system we developed uses a technique called gravimetric fecundity analysis, in which the operator views whole egg cells isolated from weighed ovaries and spread out in a sampling tray," says Pilkington. "All the egg cells in each sample are measured by displaying a fair sampling frame over the image. Cells outside or which cut the left or bottom borders are not counted, but cells which cut the right or top borders are counted." Because the cells are nearly spherical, an estimation of their diameter allows their size to be estimated. Measurements can be made manually by dragging a line across an object, or automatically, in which case Feret diameters are obtained that measure an oriented minimum-bounding rectangle in 22.5° angles.
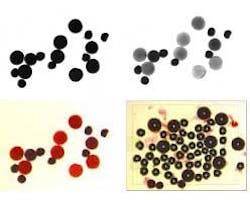
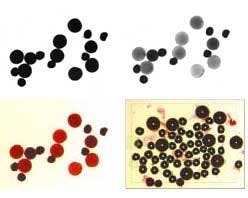
"Resolution of objects in contact is achieved by using a constrained watershed operator that has to be applied twice. Small, dense eggs are segmented from the red band of the color image with good rejection of nonegg tissue, while expanded egg cells are segmented from the green band," says Pilkington. Stained plaice egg cells are digitized, and the red and green bands from the color image are processed. Unwanted material, known as cellular detritus, shows more strongly in the green band, and small densely stained egg cells are in closer contact. Expanded egg cells do not show well in the red band. Thus, small egg cells must be segmented from the red band, rejecting cellular detritus and making it easier to resolve touching objects.
By applying watershed segmentation twice, once to the red band and once to the green band, two sets of overlapping objects are generated. Any nonegg cell objects in either set can be eliminated by filtering objects that are too small, too noncircular, or too weakly stained. Rules then determine whether the red or green band is used for each object. By rejecting any green-band object below a certain size if its centroid lies in a red band object, the green-band representation of unexpanded egg cells is filtered. By rejecting any remaining red-band object, which is still embedded in a green-band object, the densely red-stained cores of expanded egg cells are eliminated. In this way satisfactory segmentation of both the small densely staining egg cells and the expanded cells is obtained, with good rejection of material that does not represent egg cells.
Following segmentation, objects are shown with an overlaid outline, and the operator can delete anything that is not an egg cell. Manual measurement records any egg cell that segmentation did not find. When a field has been scored, data are saved in Microsoft Excel, and the overlays in the current field are moved one sampling frame width left. The operator moves the stage until the measured objects again line up with their former overlays. Saved data are then used to estimate total count of developing eggs in the ovary, from which reproductive potential can be obtained. "In addition to saving time over manual methods, the software tool has improved consistency among laboratories in Europe," says Pilkington.