Single-camera and light-source system inspects fuel-cell asbestos tiles to ensure they are free of pinholes.
By Andrew Wilson, Editor
UTC Fuel Cells (UTCFC) manufactures fuel cells-electrochemical devices that combine hydrogen fuel and oxygen to produce electricity, heat, and water. For terrestrial applications, the oxygen can be obtained from the air, and for space applications it is obtained from oxygen bottles. Since the fuel is converted directly to electricity, a fuel cell can operate at much higher efficiencies than internal-combustion engines, extracting more electricity from the same amount of fuel.
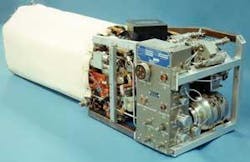
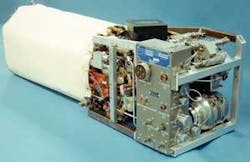
Electrical power for NASA’s Space Shuttle Orbiter is provided by fuel-cell power plants designed, developed, and built by UTCFC. In the Orbiter, a complement of three 12-kW fuel cells produces all onboard electrical power; there are no backup batteries, and a single fuel cell is sufficient to ensure safe vehicle return (see Fig. 1). In addition, the water produced by the electrochemical reaction is used for the crew drinking water and spacecraft cooling.
Each power plant contains 96 alkaline electrolyte cells that are connected to achieve 28-V output. The electrolyte is held in an asbestos matrix material between the electrodes. The cells are more than 70% efficient (a typical combustion engine is only about 25% efficient), which led NASA to select fuel cells to power the Orbiter.
Pinhole defects
Alkaline fuel cells from UTCFC were the first type of cell to be used for space applications (the very first fuel cells used in space were PEM type from General Electric). They use a potassium hydroxide (KOH) solution as an electrolyte that is contained in and supported by a matrix tile made of asbestos. The matrix tile wicks the electrolyte over the entire surface of the electrode. The asbestos matrix must be uniform and free of defects. “These defects,” says Alan Thierfeldt, manufacturing engineer with the Space and Defense Division of UTCFC, “can be as small as 10-mm pinholes located at random positions across the 10 × 10-in. tiles. Because of this, each tile must be rigorously inspected.”
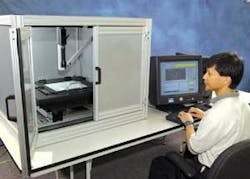
UTCFC called upon PVI Systems to replace an existing vision system with a machine-vision system capable of automatically inspecting single 10 × 10-in. tiles in approximately 5 min (see Fig. 2). The system was developed with funding from United Space Alliance and NASA.
In the existing system that had been deployed at UTCFC, four 640 × 480-pixel, RS-170 cameras were mounted over the tiles in a quad orientation. These cameras digitized images as four individual quadrants of the tile using four PC-based frame grabbers. A backlight powered by two custom light sources illuminated each tile from below.
“The existing system provided accurate detection of defects,” says Doug Wilson, president of PVI Systems, “however, PVI’s new design provided a number of improvements. First, because the resolution obtained by the RS-170 cameras produced 250-µm pixels, individual 10-µm defects in the tiles could not be easily distinguished from larger area thinning. Second, because the system used four cameras and four frame grabbers, calibrating the light responsivity of the system was difficult and time-consuming. This problem was exacerbated by the fact that two separate light sources were used to illuminate each tile.
“What was required,” says Wilson, “was a system that could more accurately measure the transmissivity ratio across the sample. The existing system measured the output light level, with the input level at a known, measured value. In the new system, the calibration of the measured camera intensities to transmissivity further improved the accuracy of the measurement. Careful system calibration was required to ensure that a tile would be graded either as pass or fail independent of the orientation of the tile. In other words, if the tile was placed under the cameras at one orientation for inspection and then rotated 90° for a second inspection, placing the defect in the field of view of another camera, the pass/fail status must be repeatable. The new system’s use of a single camera and light source eliminated the calibration effort required to match four cameras and two light sources.”
“A vision-inspection-system-based method,” says Steven Pickup, UTCFC manager of product and process quality, “has enabled us to ensure that only defect-free asbestos tiles are used in space quality systems. A replacement system was required due to age of the existing system, so improvements were made using the experience gained from its operation. The design of the new equipment continues UTCFC’s commitment to zero-defect manufacturing for space applications.”
System design
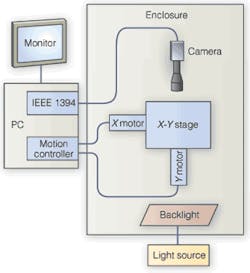
To address the demands for a fully automated and properly calibrated tile automation system, PVI developed a system using a number of off-the shelf components (see Fig. 3). To digitize images at high-enough resolution, the company chose the XCD-SX910 monochrome FireWire camera from Sony. This 1280 × 1024, 1/2-in. progressive-scan CCD-based camera was mounted above an OFL 1919-SM 12 × 12-in. open-frame stage from Danaher Motion. “Although the tiles measured only 10 × 10 in.,” says Wilson, “we required a 12 × 12-in. frame to accommodate the hold-down fixture and three 1 × 3-in. calibration devices.
The camera images a 16 × 12-mm section of the tile. Starting at the top left of each tile, the stage is then moved in a serpentine motion, digitizing approximately 250 images of each tile into a host PC. Stage motion is accomplished using MDMF2231-7ES500 stepper motors from Intelligent Motion Systems that are controlled by a PC-based PCI-7342 from National Instruments (NI).
The system incorporates a stationary fiberoptic light source from Dolan Jenner that illuminates each 16 × 12-mm section as the stage is moved across each section of the tile. “As each tile is about 0.02 in. thick,” says Wilson, “the transmissivity is only about 0.3%.” Since the expected transmissivity is so low and so many images have to be collected in a short amount of time, the incident light must be very bright. Furthermore, the lighting must be very uniform (less than 5%) over the active area. A traditional backlight would have offered the required uniformity, but did not meet the brightness requirements.
PVI decided to mount a 0.75-in.-diameter fiber bundle from the light source to a post directly under the stage. The bottom glass in both the calibration devices and the sample holder was a 3/16-in.-thick opal diffusing glass from Edmund Industrial Optics. This combination provided an active illumination area just larger than the field of view of the camera.
Correct calibration
Calibration of the light responsivity played a major part in the design of the tile-inspection system. Because each tile is manufactured of asbestos, it is wrapped in plastic to protect the user from contamination. In the inspection process, the encapsulated plastic tile is sandwiched between two sheets of glass. Says Wilson, “We realized that the light from the fiber bundles was not uniform and compensated for this by using an opal glass at the base of the stage to diffuse the light. Each tile was then placed on this glass and covered with another transparent sheet of glass to hold the tile in place.”
To properly calibrate the system, it is necessary to measure the output response of the glass/tile/glass sandwich and normalize the result against the output of light measured through a transparent piece of glass. “This,” says Wilson, “allows the software to compute a transfer function, where the ratio of the output light intensity and input light intensity provides the transmissivity of the sample.
The calibration test fixture built into the x-y stage uses a clear glass area and a neutral-density filter (NDF) that mimics the response of the glass/plastic/opal glass sandwich. While the clear glass area is used to calibrate the transmissivity function, the NDF is used as a further cross check of the linearity of the system. Two machined glass pinholes of 5 and 10 µm are also used to check the measurements performed by the imaging system. The precision pinholes provide in situ operational verification that the minimum pinhole size of 10 µm can be detected by the system.
To control both the machine vision and image motion of the system, PVI used NI LabVIEW, IMAQ Vision, and Motion software. “Because we have used these packages in numerous motion-based applications,” says Wilson, “our expertise allowed us to develop the tile-inspection-system software in just six weeks.”
As images are digitized from the Sony camera they are stored in the host PC’s image memory. After a complete serpentine pass of each tile, individual images are reassembled as a single image. Pixel values of these images are divided by pixel values of the reference image from the calibration. The result is an image that contains the transmissivity at each point. To emphasize the areas in which light is transmitted through each tile, the transmissivity image is then thresholded to determine which pixels have exceeded a specific value. This result is then displayed on the host PC. Also, pertinent parametric data, such as the size and location of each defect, are calculated and displayed in a tabular format.
To build the user interface, PVI used LabVIEW and IMAQ Version 7. “Previous versions of IMAQ did not integrate image display as well, requiring images to be displayed in windows separate from the rest of the user interface, says Nathan Lim, project manager at PVI Systems. New versions of NI’s software reduce development time and produce superior user interfaces. These windows would respond as separate windows under the Microsoft Windows operating system, a feature that was very frustrating to developers and users alike. “Now,” Lim says, “NI’s development tools can be used to integrate the image windows resulting in a much more polished user interface.”
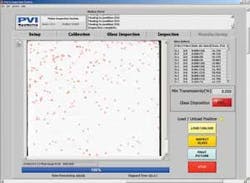
Using LabVIEW Version 7, the operator can enter part parameters such as part and serial numbers, set system parameters, calibrate the sample under test, and automatically scan the sample for defects. After parameters of each part are entered, the empty glass fixture is scanned for defects (see Fig. 4). After the entire glass area is scanned, the defects are displayed on the host PC. With this calibration interface, users can set thresholds for specific particles that may appear on the glass or should particles be very large replace or clean the glass surface.
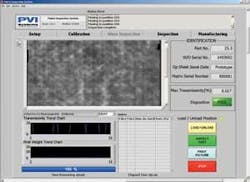
After the glass is measured for defects, a tile sample is placed in the fixture and the inspection process started. As each tile is sequentially scanned, captured image data appear in a window of the display (see Fig. 5). After scanning, defects are computed and tabulated and a map of the entire surface of the tile is produced. For statistical-process-control purposes, the transmissivity of each of the previous 30 tests is also displayed on the screen. After each inspection is complete, the tile is manually removed from the fixture and the process repeated.
“PVI Systems was proactive in providing assistance in identifying several different approaches to accomplish a rigorous screening process of detecting 10-µm pinholes,” says UTC’s Thierfeldt. “The company worked with UTCFC to understand the application and provide the best solution to accomplish the task.”
Company Info
Danaher Motion
Radford, VA, USA
www.motionvillage.com
Dolan Jenner
Lawrence, MA, USA
www.dolan-jenner.com
Edmund Industrial Optics
Barrington, NJ, USA
www.edmundoptics.com
Intelligent Motion Systems
Marlborough, CT, USA
www.imshome.com
National Instruments
Austin, TX, USA
www.ni.com
PVI Systems
Niantic, CT, USA
www.pvisys.com
Sony Electronics
Park Ridge, NJ, USA
www.sony.com/videocameras
United Space Alliance
Houston, TX, USA
www.unitedspacealliance.com
UTC Fuel Cells
South Windsor, CT, USA
www.utcfuelcells.com
