3D imaging systems target multiple applications
Andrew Wilson, Editor
3D imaging systems are becoming prevalent in numerous types of systems including those deployed for robotic guidance, product profiling and object tracking. To perform this task, a number of different products are available each of which presents the developer with different price-performance tradeoffs.
While perhaps the most well-known of these are stereo camera systems, other products that employ fringe pattern projection, structured light-based systems and time-of-flight cameras can also be used. In all of these systems, 3D information about the shape of the object viewed must be computed from captured data.
Stereo systems
In stereo systems, this 3D information is captured by using two cameras displaced horizontally from one another. Each camera then images slightly different projections of the object being viewed. It is then possible to match a set of points in one image with the same set of points in the second image – a task known as the correspondence problem.
By comparing these two images, relative depth information can be then computed and represented in the form of a disparity map. In this map, objects that are closer to the stereo camera system will have a larger disparity than those that are further away.
Before such 3D depth information can be accurately obtained, however, it is necessary to calibrate the stereo imaging system since any lens distortion will adversely affect the computed result. Because of this, most manufacturers that supply such passive stereo systems offer some form of calibration charts and/or software to perform this task.
Developers wishing to incorporate such passive stereo systems into their designs can either build such systems using reference designs from companies such as e-con Systems (St Louis, MO; USA; www.e-consystems.com) or purchase ready-made systems from companies such as Point Grey (Richmond, BC, Canada; www.ptgrey.com). e-con Systems Capella stereo vision camera reference design, for example, is based on OMAP/DM37x processors from Texas Instruments (Dallas, TX; USA; www.ti.com) and a stereo camera daughterboard. To develop stereo applications, the design is supplied with and SDK and sample applications for synchronous stereo image capture and depth measurement.
For those not wishing to develop their own systems, products such as the Bumblebee 2 from Point Grey provide off-the-shelf solutions. In its design, the camera system employs two 1/3in CCDs from Sony (San Diego, CA; www.sony.com) and is supplied pre-calibrated to eliminate image distortion and camera misalignment effects. With a FireWire output, the Bumblebee 2's SDK generates depth maps using the well-known sum of absolute differences (SAD) technique.
Stereo line-scan
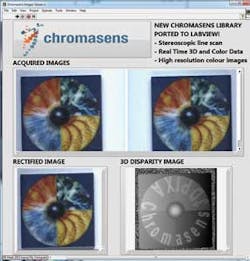
While both these systems employ area array image sensors, the same stereo imaging techniques is now being be applied to line-scan cameras. Such camera systems are especially useful in applications such as web inspection that require 3D data to be obtained from the surface of moving objects. In the design of its 3D-Pixa stereo line-scan camera, for example, Chromasens (Konstanz, Germany; www.chromasens.de), has developed a novel method of imaging 3D surfaces using a 7500 x 3 (RGB) line scan imager.
To obtain the two images required to create a disparity map, the camera system employs two lenses that are used to focus light onto both the right and left hand sides of the line-scan imager. Raw image data is then transferred from the camera over a Medium Camera link interface at 22kHz.
After images are captured, a rectified image can be produced and a disparity map generated using CUDA-based software running on an NVIDIA graphics processor (Figure 1). One this disparity map is generated, 3D- Machine Vision Library from ImagingLab (Lodi, Italy; www.imaginglab.it) can be used to perform image analysis measurements.

Laser light
While such passive systems use stereo images to create depth map information, other active 3D techniques that employ structured lasers and single cameras can also be used. Such structured laser based systems are often used in web inspection systems to generate a 3D profile of the object being imaged.
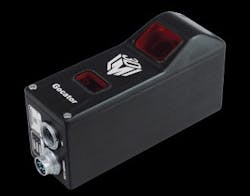
In operation, a structured laser light is first projected across the web and reflected light captured by a camera. By measuring the displacement of the reflected laser line across the image a depth map can be calculated. Depending on the application, these systems can either be configured using off-the shelf structured laser light sources with a separate camera or using 3D "smart cameras" such as the Gocator from LMI Technologies (Delta, BC Canada; www.lmi3d.com) that integrate both structured laser light sources and image detectors (Figure 2).
In both set-ups, the laser line profile is sampled by the camera system as a line of points with a finite width. To obtain the correct height information from the 2D reflected laser line profile, the center of the reflected Gaussian-like curve must be determined. This can be accomplished in a number of different ways, either by determining the peak pixel intensity across the line, thresholding the Gaussian and computing an average and determining the center of gravity of the Gaussian.
Alternatively, as in the case of the SAL-3D shape analysis library software from AQSense (Girona, Spain, www.aqsense.com), the point of maximum intensity of the Gaussian can be determined using nonlinear interpolation techniques, a method the company says is more accurate than COG methods.
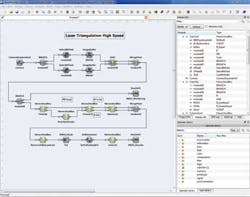
Speeding the computation of calculating the height of the laser profile can be accomplished using FPGAs. Indeed, a number of companies such as Allied Vision Technologies (AVT; Stadtroda, Germany; www.alliedvisiontec.com) and Photonfocus (Lachen, Switzerland, www.photonfocus.com) implement this in hardware in the FPGA of the camera. Alternatively, frame grabber companies such as Silicon Software (Mannheim, Germany; www.silicon-software.com) allow this task to be performed in the FPGA on a frame grabber. One such COG implementation has been developed by the company using its Smart Applets software and embedded in an FPGA on Silicon Software's microEnable IV V-series of frame grabbers (Figure 3). Once computed, height profile data can then be used to generate a 3D depth map of the object being imaged.
Fringe patterns
While such structured light-based systems are useful, they require that the camera system and laser light projector or more commonly the object to be imaged to be moved across the field of view of the system. In addition, where shiny specular surfaces need to be imaged, such systems may not prove effective. To overcome these limitations, a technique known as fringe pattern analysis can be implemented.
In this technique, a series of intensity patterns with shifting periods is projected across the object to be imaged. Phase-shifted images reflected from the object are then captured by a camera and the relative phase map or measurement of the local slope at every point in the object calculated. From this phase map, 3D coordinate information can be determined.
To illuminate the object to be imaged, a number of different methods can be used. In the design of a system to inspect large specular auto body panels, for example, Stefan Werling at the Fraunhofer Institute of Optronics (www.iosb.fraunhofer.de) use a 42-in. diagonal LCD diffuse display as a pattern generator to illuminate the object while 3D Dynamics' (Gravenwezel, Belgium; www.3ddynamics.eu) Mephisto scanner uses a digital light projector (DLP) from InFocus (Portland, OR, USA; www.infocus.com). Other companies such as Numetrix Technologies (Sherbrooke, QC, Canada; www.numetrix.ca) employ a combination of split-spectrum light projection and dual-CCD camera technology in its NX3D series of scanners.
Time of flight
While traditional methods such as stereo vision, structured light and fringe pattern projection all present the systems developer with different price/performance tradeoffs, a faster, albeit lower resolution method known as time of flight (TOF) imaging can be used in applications such as obstacle avoidance and object tracking.
Of the numerous systems now available that perform TOF imaging, both pulsed and continuous wave techniques can be employed. For its part, odos imaging (Edinburgh, Scotland; www.odos-imaging.com) has chosen the former technique in the design of its 3D Cam 3D imaging development kit. In operation, short pulses of 905nm light are emitted from a laser diode to illuminate the scene. Pulses reflected by objects within the scene and are detected by a 1280 x 1024 CMOS imager with a global shutter. Proprietary algorithms then convert the detected pulses into a distance measurement. Simultaneously, a conventional intensity image of the scene is captured so that each pixel on the image sensor provides both distance and intensity information.
While odos imaging has chosen to use a pulse technique to obtain depth information from a scene, others such as Mesa Imaging (Zurich, Switzerland; www.mesa-imaging.ch/), ifm efector (Exton, PA; www.ifm.com) and PMD Technologies (Siegen, Germany; www.pmdtec.com) use continuous wave techniques. Here, phase differences between emitted and reflected signals from the sensor system are measured and the 3D depth information computed.
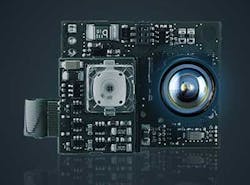
For developers wishing to integrate such technologies into their products, PMD Technologies offers a depth sensor reference design, the CamBoard nano, a 37 x 30 x 25 mm board that incorporates both a light source and image sensor (Figure 4). With a frame rate of up to 90 fps, the 160 x 120 pixel image sensor has a 90° field of view and provides both depth map and grey-scale image data. Other products such as the Swiss Ranger SR4500 from Mesa Imaging and the efector pmd 3d from ifm efector are stand-alone 3D systems.
COMPANIES MENTIONED
3D Dynamics
Gravenwezel, Belgium
www.3ddynamics.eu
Allied Vision Technologies
Stadtroda, Germany
www.alliedvisiontec.com
Aqsense
Girona, Spain
www.aqsense.com
Chromasens
Konstanz, Germany
www.chromasens.de
e-con Systems
St Louis, MO, USA www.e-consystems.com
Fraunhofer Institute of Optronics
Karlsruhe, Germany
www.iosb.fraunhofer.de
ifm efector
Exton, PA, USA
www.ifm.com
ImagingLab
Lodi, Italy
www.imaginglab.it
InFocus
Portland, OR, USA
www.infocus.com
LMI Technologies
Delta, BC, Canada
www.lmi3d.com
Mesa Imaging
Zurich, Switzerland
www.mesa-imaging.ch
Numetrix
Sherbrooke,QC, Canada
www.numetrix.ca
odos imaging
Edinburgh, Scotland
www.odos-imaging.com
Photonfocus
Lachen, Switzerland
www.photonfocus.com
PMD Technologies
Siegen, Germany
www.pmdtec.com
Point Grey
Richmond, BC, Canada
www.ptgrey.com
Silicon Software
Mannheim, Germany
www.silicon-software.com
Texas Instruments
Dallas, TX
www.ti.com
Vision Systems Articles Archives