Automated imaging system analyzes baked products
Andrew Wilson, Editor
Last year, Stemmer Imaging (Tongham, Surrey, England; www.stemmer-imaging.co.uk) was awarded the Most Innovative Machine Vision Project by the Processing & Packaging Machinery Association (Wallington, Surrey, England; www.ppma.co.uk) for its work in the development of a bread and baked product assessment system. Originally developed as a prototype by Campden BRI (Chipping Campden, Gloucestershire, England; www.campdenbri.co.uk), the C-Cell color bakery instrument was redesigned and commercialized by Calibre Control International Ltd (Warrington, Cheshire; www.calibrecontrol.com) while Stemmer Imaging redefined both the camera and lighting systems.
In operation, the C-Cell system analyzes images of crumb cell structure and distribution in baked goods such as breads, buns, pastries, cakes, and pizza products. By doing so, it eliminates the subjectivity of the analysis of the structure, texture and color of each product. Statistical analysis of features within these images then allows the baking process to be more accurately tailored to meet the needs of individual formulations.
"For example," says Steven Cronk, Software Consultant with Stemmer Imaging, "Analyzing the texture, structure and color of the bread can give valuable information to production staff about the individual processes within a modern bakery such as mixing, dividing, proving and final bake and their contribution to final product quality."
Controlled environments
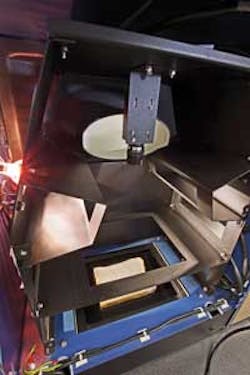
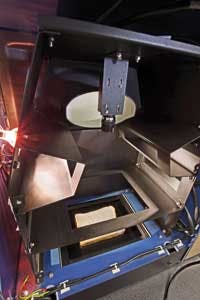
To achieve consistent, repeatable measurements, the C-Cell imaging system is housed in an enclosed, controlled environment (Figure 1). After a slice of baked product is placed in a tray and loaded into the unit, parameters such as color, the thickness of the crust, and the surface structure of the bread and crumb can be made.
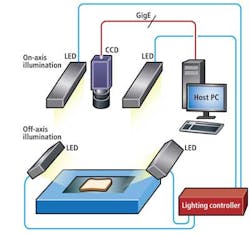
"To perform this task requires that both on- and off-axis lighting be used," says Cronk. To measure the color and crust thickness, two white 100mm LED bar lights from CCS America (Burlington, MA; USA: www.ccsamerica.com) are positioned horizontally at either side of an AT140GE GigE camera from JAI (San, Jose, CA; USA; www.jai.com). These provide the on-axis lighting required to image the color and crust correctly (Figure 2).
To highlight the surface structure of the bread and to allow accurate measurements of voids, two additional white LED bar-lights are mounted at a low-angle to provide off-axis illumination. Interfacing both sets of lights to a lighting controller from Gardasoft (Swavesey, Cambridge, England; www.gardasoft.com) allows on-axis and on-axis illumination to be controlled from the system's host PC.
Color calibration
"In the development of the system," says Cronk, "we realized that color calibration and obtaining images with the highest resolution would be most important." Thus, rather than use a single Bayer-filter based color camera, a three-chip prism based camera was chosen.
To ensure an accurate correspondence between the brightness of images and the actual reflectance of the baked product being measured, the system must first be calibrated. To perform this color calibration, it is necessary to adjust the camera gain and perform flat field correction to eliminate any spurious lighting effects in both on-axis and off-axis lighting modes.
This calibration step requires that a gradient grey-scale ramp test pattern be first placed in the imaging system. Each grey level of the test pattern will then result in a different red, green and blue brightness value. Since this value should be similar for each channel, it is necessary to examine the histogram value of each of these channels and use a look-up-table (LUT) in the camera to adjust these values to produce the correct grey-level output. This calibration compensates for any variations in lamp brightness or camera response and enables the system to compensate for any potential non-uniform illumination.
After calibration, the C-Cell system can be used to perform statistical analysis on the many types of properties associated with baked products. These include measuring the shape of the product, the crust thickness and measuring the elongation of cells in the crumb. To perform these tasks, captured images are first transferred to the systems host PC using Stemmer Imaging's Common Vision Blox (CVB) software. After images are captured, image processing libraries written in C++ are used to analyze each image.
Analyzing images
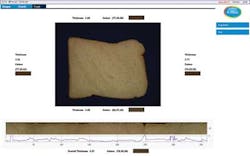
To analyze the crust of the baked product, a color image is first imaged using the on-axis lighting and thresholded to segment the crust from the crumb. Then, by using polar unwrapping, the thickness of the crust at every position in the image can be displayed in a linear fashion. By analyzing this data, the average crust thickness and color can be determined (Figure 3).
To more fully understand the baking process, the structure of the baked product must be analyzed. Size analysis of each individual cell within the bread will show how they have formed and grown in the baking process and highlight any defects that may occur due to raw material or dough handling problems. Here, off-axis lighting first is used to illuminate the product.
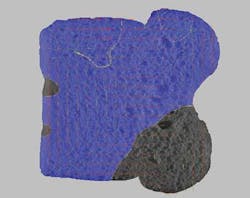
After the orientation and elongation of cells are determined using blob analysis, parallel lines (red) of varying length are overlayed over the image indicating the axis of elongation for each cell, the length of each line indicating the elongation ratio. The green vector lines point towards the center of circulation which ideally should be at one central point within the central area of the slice. The yellow lines show area's where cell elongation patterns move in opposite directions, regions of the slice that show a complete 360 degree rotational structure are shaded in bright blue while those that show a rotational structure that turns through 180 degrees are shaded in pale blue. Those showing no full rotation are shown in grey (Figure 4).
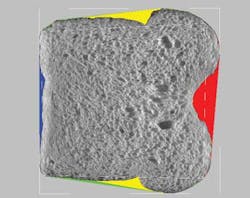
As well as examining the interior structure of the baked product, the C-Cell system can be used to determine the shape of the slice perimeter. Here, measurements of the concavity of the slice edges, for example, may indicate the presence of a side wall collapse of the loaf. To perform these measurements, the image of the slice is again thresholded and a bounding box created around the slice (Figure 5). Concavities in the sides of the slice are then overlayed in blue, green and red graphics.
Company Info
Calibre Control International Ltd
Warrington, Cheshire, England
www.calibrecontrol.com
Campden BRI
Chipping Campden, Gloucestershire, England
www.campdenbri.co.uk
CCS America
Burlington, MA; USA
www.ccsamerica.com
Gardasoft
Swavesey, Cambridge, England
www.gardasoft.com
JAI
San Jose, CA, USA
www.jai.com
Processing & Packaging Machinery Association
Wallington, Surrey, England
www.ppma.co.uk
Stemmer Imaging
Tongham, Surrey, England
www.stemmer-imaging.co.uk
Vision Systems Articles Archives
About the Author

Andy Wilson
Founding Editor
Founding editor of Vision Systems Design. Industry authority and author of thousands of technical articles on image processing, machine vision, and computer science.
B.Sc., Warwick University
Tel: 603-891-9115
Fax: 603-891-9297
