To study the individual social reactions of honeybees, researchers have developed an imaging system based on an off-the shelf camera, infrared LED illumination and custom computer vision algorithms.
Matt Pinter
Because human interaction is both intermittent and its timing unpredictable, the spreading of factors such as information or disease in human society is relatively slow. However, while intermittent and unpredictable timing may be characteristics of human behavior, other societies behave in different manners.
To study this phenomena, researchers at the University of Illinois at Urbana–Champaign (Urbana, IL, USA; www.illinois.edu) and Leipzig University (Leipzig, Germany; www.uni-leipzig.de) have developed an automated vision system based on an off-the-shelf camera, lighting, custom matrix barcodes and image processing software to study the behavior of bees. While the results of the analysis showed that while social interaction between the bees was both intermittent and unpredictable, the spreading of information throughout the colony was fast, unlike that of human social networks.
To explore the interaction of honeybees in a colony, the researchers studied trophallaxis - the exchange of regurgitated liquids between adult social insects during which two bees touch each other with their antennae.
“Since such exchanges have been implicated in disease transmission and communication, the study of trophallaxis can be used to explore the relationship of intermittency and timing and how they compare with human communication networks,” says Tim Gernat, a Graduate Student at the University of Leipzig.
Custom codes
To analyze this behavior, over 1,000 adult worker bees needed to be placed in a special-purpose observation hive. Before placement, however, it was necessary to identify each individual bee as they interacted with others in the hive. To do so, the bees were first anaesthetized and a custom barcode, known as a bCode, was placed on the thorax to allow the vision system to automatically identify the bees and track their position and orientation (Figure 1).

Figure 1: To identify bee interaction, a custom 2D matrix barcode, known as a bCode was developed using custom software based on Zxing and attached to each bee (a). While the finder pattern and the two alignment patterns are shown in dark grey, the background squares are shown in light grey. Blue squares encode the identifier and green squares encode parity symbols that are encoded as binary numbers.
Based on the design of the two-dimensional QR code first designed for the Japanese automotive market, the 2.1 mm square bCodes were printed at 800 dpi and attached to each bee using Loctite Super Glue Gel. These printable bCodes were made with custom software that builds on the software library ZXing 1.47 from The ZXing Project (https://github.com/zxing), an open-source, multi-format 1D/2D barcode image processing library implemented in Java, which was modified to work with bCodes.
Similar to QR codes, the bCode consists of black squares arranged in a square lattice on a white background. While the finder pattern in the top-left corner is used to automatically locate bCodes in captured images, the two smaller patterns in the top-right and bottom-left corner allow the orientation of the code to be determined and any visual distortions resulting from 3D rotation to be corrected. Since an error-correcting code is incorporated into the bCode, it can be read even if a part is damaged, dirty, or hidden.
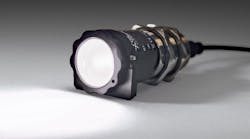
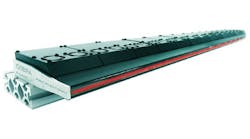
To illuminate the hive window, it was necessary to use lighting that was invisible to the bees, so that lighting would not play any role in compromising collected data. This was accomplished by using two L300-850W 850-nm infrared (IR) linear lights from Smart Vision Lights (Muskegon, MI, USA; www.smartvisionlights.com) attached on each side of a 550 × 430-mm aluminum frame mounted on a tripod and positioned at a distance of 0.8 m in front of the hive.
To increase the contrast between the honeycomb and the bees, the back of the honeycomb was also illuminated with an 850-nm IR SOBL-CBO-350x300–850 backlight also from Smart Vision Lights. Controlling these lights with a CTL-IO-4 I/O Module from Smart Vision Lights allowed the lights to be turned on only when an exposure was made from the camera. To allow for manual observation of the hive, the light from a deep-red L300-660W linear light from Smart Vision Lights was reflected from a wall opposite the hive.
Capturing bees
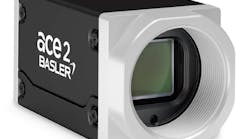
To capture images of the hive, a monochrome Prosilica GX6600 machine vision camera from Allied Vision (Stadtroda, Germany; www.alliedvision.com) was mounted on a tripod placed 1.3 m in front of the hive (Figure 2). Fitted with a Nikkor AF 135 mm f/2 D DC prime lens from Nikon (Melville, NY; www.nikonusa.com) and a 72-mm IR Dark Red (092M) filter from Schneider Optics (Hauppauge, NY, USA; www.schneideroptics.com) ensured that captured images were not overexposed when the deep-red overhead light was turned on during manual observations since this filter blocks visible light.

Figure 2: To capture images, a camera was mounted on a tripod in front of the hive. A 72-mm IR filter on the camera’s lens ensured that captured images were not overexposed when the deep-red overhead light was turned on during manual observations.
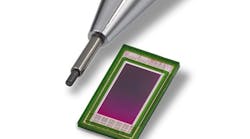
Since the camera incorporates a 6576 (H) x 4384 (V) KAI-29050 35mm format CCD imager from ON Semiconductor (Phoenix, AZ, USA; www.onsemi.com), the bCodes had a side length of approximately 38 pixels in the captured images. After images of the barcoded bees are acquired by the GX6600 machine vision camera using StreamPix 5 from NorPix (Montreal, Quebec, Canada; www.norpix.com), they are transferred over a single GigE Vision interface to the Ethernet port of a 3.3-GHz Intel i3-based PC with 4GBytes of RAM. Although the camera is capable of capturing four full-resolution images per second, it was only necessary to capture images at one frame per second.
After images are transferred, they were then stored in a redundant array of independent disks (RAIDs) with 16TBytes of storage. This was enough memory to continuously record image data from approximately 26 days. To increase the probability of detecting and correctly decoding bCodes, captured images were resized and sharpened using ImageMagick software from ImageMagick Studio LLC (www.imagemagick.org) and then detected with custom software that builds on a modified version of ZXing.
Individual interactions
While the barcodes are used to identify the bees and track their orientation and position, they are also used to determine whether instances of trophallaxis are occurring among individual pairs. To accomplish this, it was necessary to first identify pairs of bees that are close and facing each other by determining a specific distance between their heads. Assuming that the front-to-back axis of the bee passes through the bCode center and is parallel to the bCode orientation vector, the distance between the furthest front point of each bee’s front-to-back axis was calculated. “If this falls within a specific distance, it is likely that they are facing each other and are potential trophallaxis partners,” says Gernat (Figure 3).

Figure 3: To detect potential trophallaxis partners, the bCodes (shown as dashed squares) and orientation vectors of two bees in close proximity were analyzed. If the distance dij is within a given range and the sum of the angles ƴi and ƴj is smaller than a given threshold, then the bees are considered potential trophallaxis partners.
To confirm this, the shape, size, position and orientation of the head of both bees were computed using custom software that builds on ImageJ 1.47 (https://imagej.nih.gov) and the ImageJ plugins Auto Local Threshold 1.5 and Local Thickness 3.1. and any connection by a thin, dark shape resembling a proboscis or antenna analyzed. The image of two bees suspected of trophallaxis (Figure 4a) is filtered by thresholding to remove most of the honeycomb structure and reflections. The remaining bright areas (Figure 4b) are filetered again by thresholding, resulting in white areas showing the image background while black represents the trophallaxis search area (Figure 4c).

Figure 4: To confirm trophallaxis is occurring, the shape, size, position and orientation of the head of both bees were computed using custom software and any connection by a thin, dark shape resembling a proboscis or antenna analyzed. This was accomplished by first taking an image of two bees that had been previously geometrically predicted to be engaged in trophallaxis (a), thresholding the resulting image (b) to remove the honeycomb structure and again thresholding this image to highlight the trophallaxis search area (c). Analyzing the local thin pixels within these areas can then be used to highlight image areas that show thin structures such as a bee’s proboscis or antennae (d). Skeletonization of the image in Figure 4c defines paths that can be traversed to test whether there is a thin structure (green) connecting the front or sides of fitted head paths previously modelled as four quadratic Bezier curves. Overlaying the original image with the front and sides of the fitted head model of the two potential trophallaxis partners then highlights a path that traverses the tongue of the receiving bee (f). When such an event is discovered, the PC records a trophallaxis event.
Analyzing the local thin pixels within these areas for thin structures such as a bee’s proboscis or antennae (Figure 4d), results in locally thicker pixels represented with increasingly warmer colors, with rich colors highlighting the trophallaxis search area. Skeletonization of the image in Figure 4e defines paths that can be traversed to test whether there is a thin structure (green) connecting the front or sides of fitted head modelled as four quadratic Bezier curves.
Overlaying the front and sides of the fitted head model (in magenta) of the two potential trophallaxis partners and a path through a locally thin search area (shown in green) onto the original image then highlights a path that traverses the tongue of the receiving bee (Figure 4f). When such an event is discovered, the PC records a trophallaxis event.
Detected trophallaxis interactions were then analyzed with scripts written in Python 2.7 from The Python Software Foundation (www.python.org) and in R 3.2.0 from The Comprehensive R Archive Network (https://cran.r-project.org), using the packages sqldf 0.4.10 that allows the manipulation of R data frames using SQL (https://libraries.io/cran/sqldf/0.4-10) and the igraph 1.0.1 library and R package for network analysis (http://igraph.org/r). Statistical analysis was then performed in R.
Companies and organizations mentioned:
Allied Vision
Stadtroda, Germany
www.alliedvision.com
ImageMagick Studio LLC
www.imagemagick.org
Leipzig University
Leipzig, Germany
www.uni-leipzig.de
Nikon
Melville, NY, USA
www.nikonusa.com
NorPix
Montreal, QC, Canada
www.norpix.com
ON Semiconductor
Phoenix, AZ, USA
www.onsemi.com
Schneider Optics
Hauppage, NY, USA
www.schneideroptics.com
Smart Vision Lights
Muskegon, MI, USA
www.smartvisionlights.com
The Comprehensive R Archive Network
https://crain.r-project.org
The Python Software Foundation
www.python.org
The University of Illinois at Urbana–Champaign
Urbana, IL, USA
www.illinois.edu
The ZXing Project
https://github.com/zxing
Analyzing trophallaxis interactions as temporal networks with nodes representing individuals revealed that honeybee interactions are both intermittent and unpredictable but faster than those of human social networks.
According to Gene Robinson, Director of the Carl R. Woese Institute for Genomic Biology at the University of Illinois, the project will lead to further exploration of honeybee networks, how they function and what such results may mean for human social networks.
Matt Pinter, Director of Engineering, Smart Vision Lights (Muskegon, MI, USA; www.smartvisionlights.com)