Cross-process analysis of images, image data and other process data improves quality, process control, and enables continuous process improvements
Patrick Chabot
A machine vision system employed for quality inspection in manufacturing has two outputs – an image, and the data associated with the image. The former is obvious – a picture, after all, is worth a thousand words. The latter is perhaps less obvious, at least when it comes to using machine vision to its full potential to improve quality and drive continuous improvement on the production line.
As improvements in machine vision technology have spurred broader adoption, many manufacturers are starting to take full advantage of the intelligence trapped within their vision systems. Vision systems generate a large volume of data aside from the actual images. And more and more manufacturers are leveraging this data to help improve process yield and performance.
As manufacturers come to understand the distinction between the images and “data” that a machine vision system generates, they realize the image is more of an artifact of the process and how useful the data can be.
The shift in thinking is that the real data provided by a vision system is the scalars, arrays and strings that are associated with the image, and that these can be used for additional analysis and trending to verify that a manufacturing process remains within spec, part after part.
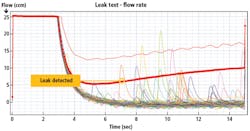
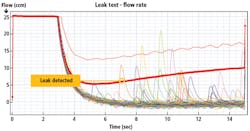
Figure 1: The graph shows flow versus time trending results from a series of leak tests, with an acceptable range of deviation for a pass result. Any spike above the red line indicates a leak substantial enough to be considered a failure.
Spot issues before quality suffers
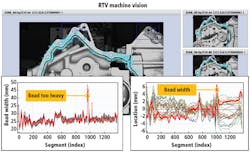
A great example is using machine vision to evaluate the dispense of a sealant bead on a part. From the image, the vision system can break down the sealant bead into thousands of regions and for each region, measure the width of the bead and the offset from expected center position. Each region has unique scalar measurements derived from the images, as well as the limits that determine whether the dispense in that region is acceptable (Figure 1).
These measurements can be stitched together as an array to provide a digital process signature that shows how the dispense measurements vary across all the segments, which can then be used to create different reporting visuals such as histograms of the machine vision data for each part and segment-based trends of measurements (Figure 4).
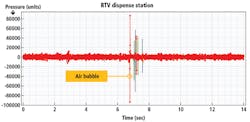
Figure 2: Fluctuations in pressure as a bead of sealant is dispensed and applied to the surface of a part provide evidence of an air bubble. Such trapped air can result in a faulty seal and a leaking part.
A decade ago, manufacturers would have been content with the overall status for that dispense action on that part, as indicated by the image. Now, they want to get all these individual measurements because they can use these data arrays to trend the behavior of the robot as it applies the sealant. Such an approach makes it possible to spot early any indicators of misalignments, worn or damaged nozzles, trapped air (Figure 2), erratic movement or any other issue that may affect bead quality. Quality engineers can use this insight to adjust and fine tune processes before an issue leads to bad parts.
But taking advantage of this insight requires new approaches to data management and analytics to effectively collect, interpret and act on the data.
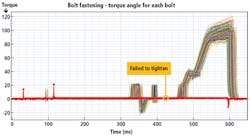
Figure 3: Sensor data plotting torque versus time to measure and verify that each bolt was tightened down as part of a rundown operation joining two parts shows that at around 460ms, there was a surge in torque force as the bolt was tightened. The red line indicates a lack of torque force where, for whatever reason, a bolt was not tightened correctly. This may be the cause of a fail at the leak test station.
Eliminate data silos
Machine vision data collection is often still a granular process. Images are stored in or around the vision station, if they are kept at all, which creates several data silos around the plant. A large manufacturing line might have a variety of vision systems from different vendors. In this scenario, the need to collect data from across the plant floor with a pocketful of flash drives, along with incompatible data formats, makes it exceedingly difficult to cross-reference and integrate vision data efficiently with data from other process and test stations on the line.
The trend now is to get away from silos and bring data together to have better analytics and from that, better manufacturing performance by being able to better target the areas where efficiency can be improved.
Once data silos are eliminated, managing and using the vision data becomes easier – the same tools can be used for all manufacturing data. Having a common method to manage the data and a common method to visualize the data greatly reduces learning curves for people interacting with these systems.
Of course, that requires the adoption of an analytics platform that allows for all production data to be collected in a single place. Fortunately, the cost and complexity of deploying such systems on an existing production line, and integrating them with existing IT investments, continues to fall.
Figure 4: The surface of a part receiving a bead of sealant is divided into regions, which can be indexed and correlated with sensor data that tracks the width and thickness of sealant bead. This data can be matched with the corresponding machine vision images to verify a good dispense, or locate a bad one, when trying to trace the root cause of a leak at a downstream test station.
Simplify root cause analysis
A typical production line contains various assembly steps, intermixed with testing stops where the assembly process is verified, which includes functional testers, vision systems for error proofing and so forth. The ability to look at the rich data generated by all assembly steps and all test systems in a single place—including process sensor curves and vision data—provides the operator with a complete picture of exactly what happened in the assembly process, as opposed to looking only at numeric information, which may not.
To expand on the previous example, consider an application in which vision data has been used to generate a trend for a sealant dispensing operation.
Such an implementation creates an extensive record—a data trail—for every part coming through that dispensing station. Add to this data from the press-fitting station where that part is assembled with another, data from fastening tools (Figure 3) that are doing several rundown operations on the assembled part at another station, and finally, data from the leak test of the completed part.
Having data from these four distinct processes in one place creates a birth history record for each part. Quality engineers can now start to see how results at each step can affect downstream processes for a part.
If a part were to fail a leak test, the quality engineer could visualize the assembly process in a virtual environment to confirm that the fasteners were torqued to spec, the press generated correct depth and force, and that it was the sealant application with a borderline acceptable result in a single region of the bead that led to a leak failure.
This setup allows for quick root-cause determination because the engineer can visualize each process and determine exactly where the problem was introduced and then apply specific corrective action to eliminate it. Without that level of information, determining which upstream process was the actual source of the leak could be quite daunting. Without knowing the source of the failure, it would not be possible to improve yield or quality or reduce scrap.
Quickly finding the failure point means the process can be improved and requirements can be tightened. In addition, algorithms can be written to search all existing birth history records for previously tested parts that would no longer meet these new requirements, allowing for a selective recall of parts with a similar anomaly that might not have been quite bad enough to fail the leak test but could still fail in the field under normal use.
This becomes a powerful quality assurance tool to catch defects, reduce warranty claims and avoid mass recalls.
What’s next?
Merging vision data with other data generated in the plant floor maximizes the manufacturer’s ability to analyze how different processes can impact each other and improve yield through cross-process analytics. While people remain key in performing most of these analytics tasks, the trend is building towards artificial intelligence stepping in.
Applying artificial intelligence to something requires data from which to learn. The more data, provided it is accessible and integrated, the higher the machine learning potential. Getting data from every part of the manufacturing process, vision data included, is crucial for artificial intelligence to become commonplace in manufacturing.
However, because machine vision system interfaces vary dramatically from system to vision system, more and more manufacturers are working with the vendors of machine vision systems and the vendors of Industry 4.0 data management and analytics platforms to overcome these issues.
Why? Because machine vision has a key role to play in the smart factories of the future, where automated manufacturing lines self-adjust to maximize quality, output and profitability.
Patrick Chabot, Manufacturing IT Manager, Sciemetric Instruments (Ottawa, ON, Canada; www.sciemetric.com)
File storage: Cutting vision down to size
Vision does a pose a unique challenge to the process of data integration.
Large manufacturers generate terabytes of image data a month, even a week. The raw image files, which are the common output from vision systems, are huge. But the raw image must only be stored if the intention is to reprocess it. To maintain an archive of images for compliance purposes, there are many techniques to reduce image file size, from changing resolution to using a compressed format. Images can be reduced to a tenth the size of the original, or even less, and the naked eye can barely notice a difference.
Put vision data to work
Making the most of machine vision data to improve quality and drive continuous improvement on the manufacturing line requires a data management and analytics platform that can consolidate data from various sources on the plant floor. The cost and the complexity of deploying such a system and integrating it with existing IT investments continues to fall.
- What capabilities should such a platform have and what benefits will it grant?
- The power to integrate scalar data and images, including image overlay information, from multiple cameras, traceable to a part serial number
- Image and data capture for vision systems with limited or no storage capability at the camera level
- Data collection and consolidation from leading camera vendors
- Freedom from having to wander the plant floor with USB sticks to move images from stations on the production line to a central system for re-analyzing
- Manufacturing analytics that enable fast retrieval, review and analysis of image and scalar data
- Flexibility to scale from a single station to all cameras to all inspection systems on the plant floor
