Eight reasons why you should manage your machine vision data
By Mathew Daniel
In manufacturing, an image can be worth a thousand data points, and yet machine vision is often used only for basic pass/fail determinations. Images and their related data sets, if they are kept at all, are scattered throughout the plant in silos that lack any digital connectivity.
Machine vision data is no different than any other data in the plant. It can be used as part of the whole to help drive quality, improve yield and contribute to faster resolution of quarantines and recalls. In this article, I present eight reasons why you should lever this data together with the rest of your process and test data, to drive the profitability and competitiveness of your plant.
#1: Gain manufacturing insight by monitoring station performance
Quickly highlight stations that are falling behind in part count or in first time yield. This can be particularly useful for parallel station comparisons. For example, web-based dashboard “widgets” can display top 10 failures for a particular machine or parallel machines, or for a particular shift or time period, to pinpoint leading failures in production real-time.
#2: Feature trend analysis
Set limits fast to quickly launch and dial-in new vision stations. Bottlenecks can be identified immediately, and their root causes diagnosed and eliminated systematically. New control limits can be verified and easily adjusted. Indicators from the new line can be matched against existing ones to give a strong indication of conformance. In addition, you can track time-of-day or product variances by model.

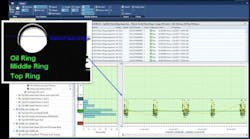
statistical limits and upper and lower specification limits.
#3: Provide evidence of complianceTrend of data generated from camera images showing statistical histogram, statistical limits and upper and lower specification limits.
Image and image data that reside in a central database and can be recalled by a part’s serial number makes it easy to provide evidence that the part was built to specification and that manufacturing and test processes were under control. Images of the product as shipped can also be used to verify the status of what left the plant.
#4: Track limit changes
If limits are changed at the vision station, these are tracked in feature trend reports. Limits can be reviewed by model/serial number. Specific limit changes can be timestamped for a clear picture of their impact on production and which parts were built to the new limits.
Once the ideal limit settings are established, they can then be applied to like or parallel stations elsewhere in the plant or at another plant altogether. This strikes back to Point #2 – launch new equipment faster.
#5: Part failure process analysis
Review data from multiple processes to trace root cause of a failed part. This is critical to quickly address the issue and mitigate its negative impact. Take, for example, the failure of a seal in a joint. If all that part’s related data is collected into a single comprehensive birth history record, you can take a comprehensive look at the joint’s leak test results, fastening data, dispense data, real-time video image and real-time video bead data to quickly identify and address the issue, as well as determine if any other parts are risk of the same failure.
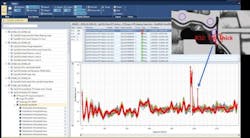
that shows a sudden variance in bead width outside of spec.
#6: Waveform trend analysis
Analyze image-based profile (waveform a.k.a. digital process signature) data to adjust and fine tune processes such as dispense systems or robots, and to track failures. Bead location and width, for example, can be tracked with a regional waveform. Histograms can be created that track the time-based minimums, maximums and averages for each region of the part.
#7: Advanced analytics – ‘What if’ analysis
Generate feature trend reports to analyze the impact of new limit settings. You can also use all your historic data to play “what if?” – create algorithms and run simulations to understand the impact of new limit settings. See the pass/fail impact and determine new limits to catch previously missed pass/fails. This allows you to evaluate the impact of limit changes and fine tune processes in a virtual testbed without disrupting production.
#8: Product containment
Use this same what-if analysis to data mine for suspected defects. In this way, you can contain contaminated work-in-progress before it ships and selectively recall faulty products by serial number. Respond faster to a quality issue and accurately triage the problem to limit the scope of a recall, both in terms of cost and PR impact. But this of course requires that you have collected all the production data related to the part, from every process and test station on the line that touched it, into that single consolidated birth history record.
In summary
Levering the full potential of your vision data is easier than ever. Images and image data can be stored and reviewed in production real-time (within one cycle of cycle completion) thanks to the falling cost of sensors and data management systems, network topology and throughput, and multi-terabyte class storage.
Bringing images and image data into a part’s birth history record opens the door to advanced analytics for process improvement and traceability for defect containment. It just takes careful planning to determine how best to collect, store and manage the data for analysis and reporting.
Mathew Daniel is Vice President of Operations at Sciemetric Instruments, where he manages service and installation, product development, and manufacturing and quality. Mat oversees many of the manufacturing data and analytics implementations provided to large manufacturers, helping them to organize and maximize a return from their production data.