Scanning Scallops in 3-D
Pablo Martínez, Marta Alonso, and Manuel Álvarez
Historically, classifying scallops has been a manual task involving numerous workers who employ mechanical gauges to estimate the size and shape of each mollusk. Due to the measurement uncertainty of these gauges and the associated subjectivity of visual inspection, such processes are both operator intensive and subject to human error.
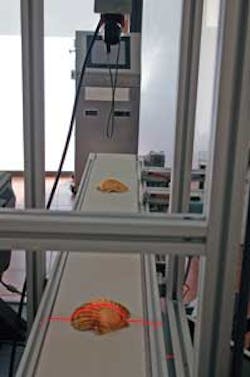
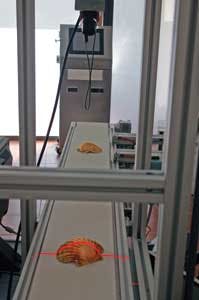
Saec-Data, a company dedicated to designing, developing, and implementing computer-based systems for the maritime industry, approached AIMEN Technology Centre to develop an automatic inspection/classification system based on machine-vision technology (see Fig. 1). Providing an objective method to classify the size of scallops while simultaneously reducing the number of operators required, the system can inspect scallops at the rate of two scallops per second.
classify scallops.
Sorting scallops
In the first sorting step, the scallops are placed on a conveyor belt that moves them with constant speed under the imaging system’s field of view. The scallops are illuminated by an SNF 660-nm, 35-mW structured power laser from Coherent with a fan angle of 20º.
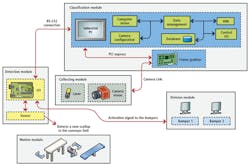
At the beginning of the belt, a photocell detects each scallop as it passes along the conveyor and sends a trigger signal to an I/O board embedded in an industrial PC. This signal is then used to trigger a MV-D1024E-3D01 camera from Photonfocus that transfers image data to the PC over a Camera Link interface. At this point, an X64 Xcelera-CL dual frame grabber from Teledyne DALSA is used to transfer captured images into the host memory of the PC (see Fig. 2).
Programmed in C# with Microsoft Visual Studio 2008, the software uses a dynamic-link library (DLL) to communicate between the Photonfocus camera libraries and image acquisition, configuration, and processing libraries.
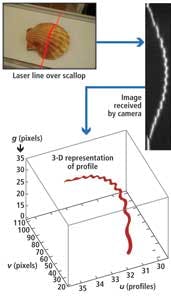
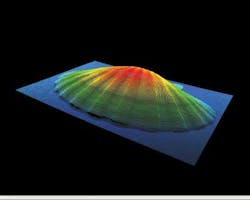
As the scallops move across the structured laser light’s field of view, a three-dimensional (3-D) profile of the scallop is captured (see Fig. 3) where g represents the height at each point of the profile, u the total number of profiles scanned, and v the width of each profile. Once the profile of each scallop is performed, a range map of the scallop is generated and a 3-D representation produced (see Fig. 4).
FIGURE 3. As the scallops move across the field of view of the structured laser light, a three-dimensional (3-D) profile of each scallop is captured by the CMOS camera.
Shape and size
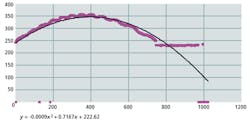
AIMEN developed several algorithms to calculate the shape parameters of the scallop. The volume of the scallop was computed by comparing the similarities between the shape of a scallop and a parabola fitted to this curve. Figure 5 shows a single profile of a scallop, where the points obtained from the 3-D vision system (in pink) are compared to a parabola (in black) that fits the values obtained from the scallop, with the mathematical equation that defines it.
This approximation allows the section of the scallop to be calculated by the integration between two points of the corresponding parabola, using Simpson’s rule—a method for numerical approximation of definite integrals.
Another algorithm was used to calculate the greatest distance between the start and end points of the overall profiles so the major axis of the scallop could be defined. To define the minor axis, two points of the scallop’s profile, which are equidistant from the endpoints of the major axis, were calculated.
To calculate the area of each scallop, the similarity between the surface of the scallop and an ellipse were compared in a manner much like that applied to calculate the volume. Since the ellipse axes correspond to the main axes of the scallop, the area can be calculated as
Area = π * A * B
Rocks and seaweed
To distinguish between scallops and other objects such as rocks or seaweed, the ratio between certain values of the range map that are distinctive for the scallops are compared with those of the foreign matter. If these are not statistically within limit, then the object is eliminated using a reject mechanism located farther along the conveyor.
A graphical user interface (GUI) provides the machine operator with a means to set system parameters and display real-time data of the classification process. Several drop-down menus are used to set data such as the scallop provider and the type of classification. In operation, the interface displays information about the diameters of each scallop and the amount of scallops classified in each category.
Each different type of scallop can then be sorted using a reject mechanism that uses the classification data to transfer the data from the PC to the I/O board over an RS-232 interface. An output relay from the PC then activates a cylinder of a specific reject mechanism and expels the scallop.
While the desired rate of two scallops per second was achieved, faster classification is only limited by the speed at which the reject mechanisms push the scallops from the belt.
The system was tested with different sizes of soaked scallops randomly entering the conveyor belt. In operation, the system successfully determined different sizes and shapes of scallops and sorted them into different containers. By detecting the shape of each scallop, the conveyor could be fed both scallops and other objects such as rocks and seaweed. Most of these objects could be sorted by the vision system, the only limitation being that that scallops needed to be fed onto the conveyor flat-side down.
Pablo Martínez and Marta Alonso are at Saec-Data (Vigo, Spain) and Manuel Álvarez is at AIMEN Technology Centre (Porriño, Spain).
Company Info
AIMEN Technology Centre
Porriño, Spain
Coherent Inc.
Santa Clara, CA, USA
Photonfocus
Lachen, Switzerland
Teledyne DALSA
Waterloo, ON, Canada
Vision Systems Articles Archives
