Multispectral Imaging Plants Roots in Quality Control

Paul Falkenstein
Multispectral imaging has become an enabling technology for both research and commercial tasks in life sciences fields. On one hand, processing data from visible, infrared, and/or ultraviolet spectra has moved markets such as medical diagnostics forward with targeted techniques for finding cancer and detecting eye diseases like macular degeneration, for example. On the other hand, it has also been investigated for use in more industrial applications that range from tracking livestock health to color-based inspection of fruits and vegetables to sorting plants and seedlings for quality control. Read on to find out how multispectral imaging has been applied to commercial horticulture operations, making it possible for plant providers to directly measure product quality and successfully control growth to produce hardier plants.
Germination is the process by which plants emerge from flowering seeds and begin to grow. Monitoring this seed germination process can provide horticultural companies with a direct measure of product quality and allow them to successfully control germination to produce better plants. Unfortunately, manual monitoring of the seed process can be slow and subject to operator error.
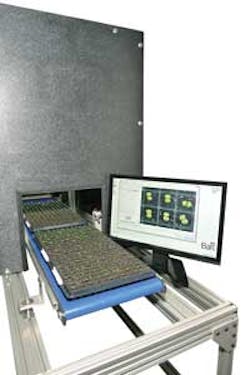
To eliminate manual errors while speeding up the inspection process, Coleman Technologies has developed an automated vision system that combines multispectral imaging, 3-D, and chlorophyll measurement techniques. Developed in conjunction with the Ball Horticultural Company, the system is capable of inspecting and classifying seedlings at rates greater than 1000 seeds per minute (see Fig. 1).
Seed germination
Seed germination is composed of discrete stages; each represents a significant milestone in the development of the plant. In the early stages of germination, for example, a root tip and roots may appear, while in the later stages a stem and a leaf may begin to appear. Identifying the stage of germination is important because the future health of a plant is determined by the germination process. Not all seeds germinate from any given batch, and changing environmental factors including water content, oxygen levels, light, temperature, and chemical exposure affect the germination process.
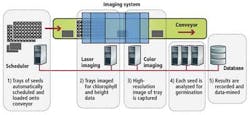
To provide a controlled environment in which the germination process can be accurately monitored, seeds are first placed in user-defined grid trays (typically microtiter plate or seed plug trays) where they grow on blue filter paper or in soil. This allows separate images of each seedling to be discretely captured by the imaging system. Rows of these seed trays are then placed onto a conveyor belt where they are transported into an imaging station to determine the stage of germination of the plant, its dimensions, and its chlorophyll levels. Results of these inspections are then logged into a database where they can be data-mined for various statistical analyses.
In the first part of image inspection, two 4k color GigE linescan cameras from Teledyne DALSA are used to digitize color images of the plants as they pass through the conveyor. A scheduler selects either camera, with one 4k camera having a 4-in. field of view and the other a 12-in. field of view. This allows imaging at 25 µm/pixel or 75 µm/pixel. The system can handle trays of seeds measuring up to 12 × 24 in. Images from these cameras are then transferred over the GigE interface to a dual-port GigE interface board in a hexacore PC.
Traditional RGB color-based image processing could not be used to analyze these images due to the inconsistent colors, background variation, and shadowing effects produced by the 3-D seedlings. Instead, RGB images were mapped to hue, saturation, and lightness (HSL) and a histogram of each individual image plane calculated. From these image planes, the seed, root, and stem features of the individual seedlings can be classified (see Fig. 2).
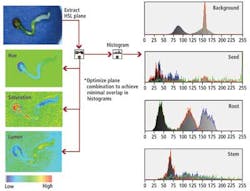
To classify each individual seedling, the system was first presented with a number of different seedlings at varying stages of germination. From these multiple HSL data maps, the distribution mean and standard deviation of each histogram were computed and a mathematical cost basis function developed to analyze the various classes of seedlings.
Chlorophyll and 3-D
While cost basis functions are useful in determining seeds, roots, and stems associated with each plant, using these data in conjunction with the 3-D structure of the plant and its chlorophyll content can produce more reliable results. To measure the 3-D and chlorophyll content data, it was initially thought that an off-the-shelf 3-D structured-light measurement system and a separate chlorophyll meter were required.
Unfortunately, traditional off-the-shelf chlorophyll readers require several seconds to take individual chlorophyll readings and have to be positioned very close to the plant. However, since chlorophyll has an emission peak of 680 nm when excited with a 650-nm laser, both chlorophyll measurement and 3-D profiling of the plant could be accomplished simultaneously by using one camera and one laser.
In a second imaging workstation, a structured 650-nm laser light was used to illuminate the seedlings as they passed along the conveyor. Emitted light from the chlorophyll molecules is then captured by a 2048 × 2048-pixel ace-2040-180gm Camera Link camera from Basler at 300+ frames/sec. Using a 662-nm high-pass filter, the reflected laser light can be removed and only chlorophyll fluorescent signal is measured. Data from this camera were then transferred to a host PC using an NI-1433 Camera Link frame grabber from National Instruments (NI). Sets of measurements using high and low laser power are then collected and the ratio used to determine the chlorophyll content.
Rule-based statistical scoring and shape/morphology algorithms within NI's Vision Development Module (VDM) were then used to determine the probability that a region of the image contains a specific plant part (see Fig. 3). To do so, images representing the color image of the seedling, the chlorophyll, and the height map were used to measure the dimensions of each plant part. The data were then stored for later statistical analysis. Here, a divide and conquer strategy is used.
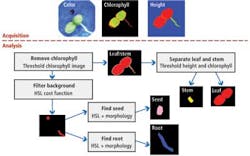
Checking the presence of chlorophyll determines whether the plant has entered the stem or leaf stages, and so can determine whether they are mature. Leaves and stems can be separated by both relative chlorophyll levels and height. Remaining parts such as the seed root and background are then separated using statistical analysis. When no chlorophyll is present, only the root and seed can be present, which are separated using combined HSL statistics and shape for seed verification.
Paul Falkenstein is vice president of automation and inspection at Coleman Technologies Inc. (www.colemantech.com).
Company Info
Ball Horticultural Company
www.ballhort.com
Basler
www.baslerweb.com
Coleman Technologies
www.colemantech.com
National Instruments
www.ni.com
Teledyne DALSA
www.teledynedalsa.com