Raman Spectroscopy Performs High-Quality Materials Sorting
Martin De Biasio
Recycling materials prevents waste of potentially useful materials; however, manual sorting is labor intensive and can cause health problems. These limitations led to a demand for fully automated waste-sorting technologies based on machine-vision technologies that can sort tons of waste material every hour and operate for 24 hours a day.
However, there are certain materials that cannot be discriminated with sufficient accuracy using standard off-the-shelf vision components. To properly recycle glass, for example, different types of glasses must be individually sorted. If not, the different glass types each with a different melting point will result in an uncontrolled mixture that when melted will result in recovered glass that is prone to cracking during cooling.
Raman spectroscopy solution
In traditional machine-vision systems, glass materials may be sorted with visible-light camera systems or x-ray fluorescence systems. However, visible-light systems exhibit limited selectivity, and x-ray-based systems are expensive. These limitations can be overcome by using a classical nondestructive laboratory method known as Raman spectroscopy.
The Raman effect occurs when light interacts with the chemical structures in a material. If a material is illuminated with high-energy, monochromatic light—typically a laser light source—the incident light is scattered. Most of this light is elastically scattered by Rayleigh scattering, at the wavelength of the excitation light source, and does not provide any information about the material. However, a small part of the incident light interacts with the material and is inelastically scattered. This causes an energy difference called a Raman shift. The energy shift between the incident laser light and the inelastically scattered light is typically expressed in wavenumbers (cm-1) and is unique to the molecular composition of the material.
Until recently, Raman spectroscopy was considered unsuitable for most industrial imaging applications as it requires long measurement times and is sensitive to stray light. However, advances in camera and spectrometer technology now allow Raman signals to be acquired with high spatial and spectral resolution.
System design
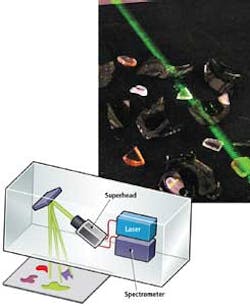
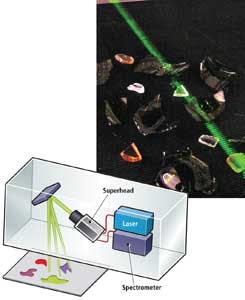
In cooperation with TOMRA Sorting Solutions, Carinthian Tech Research AG has developed a prototype of an industrial inspection system for sorting glass that is based on real-time Raman mapping spectroscopy. An OEM Raman spectrometer is used in combination with a Raman SuperHead fiber-optic probe that was integrated into a TOMRA Autosort scanner housing (see Fig. 1).
The spectrometer can measure Raman shifts between -230 cm-1 and 3300 cm-1 with a spectral resolution between 10 cm-1 to 15 cm-1. To enhance signal intensities, a 16-bit thermoelectrically cooled, back-thinned line array CCD sensor with 58 × 1024, 24 × 24-µm pixels is used in the spectrometer.
As glass samples have a high thermal destruct limit, a 532-nm laser with an output power of 2 W is used for the excitation of the glass. The SuperHead probe consists of a laser line filter that filters additional sidebands of the excitation laser, and a Rayleigh filter that blocks the Rayleigh scattered intensity in the Raman spectrum.
A custom lens with a diameter of 3 in. focuses the laser spot to a size of approximately 750 µm2 on the measurement samples at a distance of 250 mm. The front lens focuses the laser spot and collects the Raman scattered light from the measurement samples. A polygonal scanning mirror—i.e., a mirror with multiple facets—that rotates at a constant user-defined speed reflects the laser spot onto the different spatial positions on the conveyor belt and collects the Raman signal at these positions. A specially designed f-theta scanning lens is placed in the beam path after the scanning mirror. This optic ensures that the axis of the focused laser beam is perpendicular to the scanning plane.
Spectroscopic information
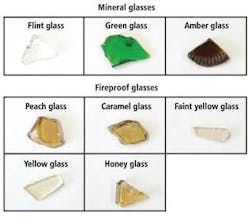
To evaluate the system, mineral glasses and fireproof glasses approximately 1-2 cm in diameter were extracted from an industrial recycling process. Mineral glasses were divided into green glass, flint glass, and amber glass. Fireproof glasses were divided into peach glass, caramel glass, faint yellow glass, yellow glass, and honey glass (see Fig. 2).
The Raman system operates with a chemometric model, which is stored in the evaluation unit, to discriminate between glass types. Using the fingerprint in the Raman spectrum of the material, mineral glass and fireproof glass can be discriminated. Figure 3 shows typical Raman spectra of fireproof and mineral glass in the fingerprint range between 200 cm-1 and 1200 cm-1.

In Fig. 3, there are three characteristic Raman peaks. These are used as features F1, F2, and F3 to discriminate between the glass types. Due to the low readout times for the measurement of the Raman spectrum of each measurement sample, there is spectral noise on the features.
Because of this, each spectrum is smoothed with a Savitzky-Golay smoothing filter and L1-normalized. As the peak position of the features F1, F2, and F3 are stable, the Raman system uses Fn = (I(A) + I(B))/2 - I(C) to calculate the local peak intensity, where I(A) and I(B) are intensities next to the maximum of the peak amplitude and I(C) is the maximum peak intensity of F1, F2, and F3. A linear classifier is then used to discriminate between glass types.
System deployment
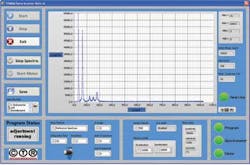
When deploying the system, the Raman spectrometer is interfaced to a PC via USB interface. The PC is also used to interface to a rotating mirror controller from Maxon Motor AG that scans the laser across the field of view of the conveyor. A graphical user interface (GUI) displayed on the PC shows the status of these devices (see Fig. 4). Once connected, the operator closes the aperture of the Raman SuperHead fiber-optic probe and takes a dark spectrum. The dark spectrum is stored in the evaluation unit to compensate for sensor noise and the influence of stray light. Once this is done, the operator opens the aperture, sets the conveyor belt speed and the integration time of the spectrometer, and starts the program.
Depending on the conveyor belt speed, the laser beam is moved over the belt and measures the Raman signals of the glass samples with a minimal readout time of 8 msec. A feedback sensor that is connected to the motor controller provides information when a new facet of the polygonal scanning mirror is in position. The time between two pulses of the feedback sensor is then used to estimate the position on the conveyor belt at which the Raman signal is measured. This position is essential for the subsequent automated sorting process, which is performed with air nozzles that blow out the glass samples into the appropriate container.
To further analyze the measured data, the operator can save all the data to a hard disk. Therefore, he or she simply has to set the data file path and push the save button.
Currently, the Raman system is still in the prototype phase; before it can be applied to industrial glass recycling facilities, the speed of the system must be improved. State-of-the-art sorting systems working in the near-infrared (NIR) scan between 40 and 320 kHz—the Raman spectroscopy system currently operates at a maximum speed of 100 Hz.
Further research will include enhancing the output power of the laser, improving the optical design of the sensor, using larger optics to collect more of the Raman signal, and attaining readout times in the microsecond range. Once the speed of the system has been sufficiently improved, it will be applied to glass sorting in an industrial recycling facility.
Martin De Biasio, Dipl.-Ing., is with Carinthian Tech Research (CTR) AG (Villach, Austria; (www.ctr.at).
Company Info
Carinthian Tech Research AG
www.ctr.at
Maxon Motor AG
www.maxonmotor.com
TOMRA Sorting Solutions
www.tomrasorting.com
Vision Systems Articles Archives