3-D IMAGING : 3-D scanner digitizes bone structures of fish for research

To identify different types of fish and the relationships between various species, Antoni Lombarte at the Mediterranean Center for Marine and Environmental Research (CMIMA; www.cmima.csic.es) is using a 3-D image scanner to digitize otoliths-calcified structures found in the inner ear of fish. Each fish species is characterized by a specific morphology of otoliths, which can be used in automatic identification tasks. Using 3-D images helps to increase the efficiency of these systems.
Because the structures are not digested when fish are eaten by other prey, they provide an indication of the diets of specific species. Moreover, since otolith growth is related to the fish's growth and the environmental changes in the fish's habitat, studying the proportions of the various components that make up the otolith can determine fish growth, mortality, and population dynamics.
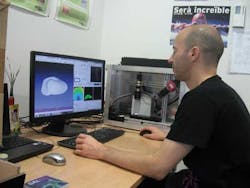
To analyze and classify these otoliths, Lombarte and his colleagues called upon Josep Forest, PhD, in the Computer Vision and Robotics Research Group at the University of Girona (http://vicorob.udg.edu) to develop a structured-light-based scanner (see Fig. 1). For the PC-based system, a 2-D x-y stage driven by a SmartMotor from Moog Animatics (www.animatics.com) was used to position the otolith under the field of view of a structured-light imaging system.
Using the SmartMotor's linear encoder, it was possible to position the otolith at 25-µm increments under control of Animatics SmartMotor Playground software over the PC's USB interface.
"In the initial implementation of the 3-D scanner," says Forest, "a structured laser light was used to illuminate the otolith." The structure of the otolith is composed of fibrous aragonite crystals, so penetration of the laser light within the material was considerable, resulting in a lot of speckle noise. This led to reflected light with randomly varying amplitude and phase.
To reduce this speckle noise, Forest chose a white LED line-pattern generator from Effilux (www.effilux.fr) to illuminate the otolith at a linewidth of approximately 50 µm as it is moved along the x-y stage. At each 25-µm increment, the reflected light is then captured by an MV-D1024E-3D01-160-CL-12 Camera Link camera from Photonfocus (www.photonfocus.com) that is triggered using the SmartMotor Playground software.
The CMOS camera incorporates an FPGA that embeds a light-stripe peak detector from AQSENSE (www.aqsense.com) to compute the maximum intensity of the laser line. This peak detector operates on 2-D images and returns the maximum value of each pixel within each line of reflected light over the camera's Camera Link interface. The data are then captured using a microEnable IV frame grabber from Silicon Software (www.silicon-software.com).
Thus, a set of point-cloud data that describes the x, y, and z (depth) position of the object can be generated from the positional information returned by the linear encoder and the depth information returned by the camera.
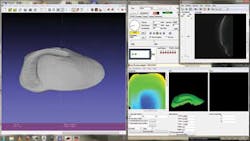
The 3-D scanner uses Photonfocus 3D Suite that allows the line profile of each otolith to be viewed as it is digitized (see Fig. 2, top right). The SAL3D 3-D shape analysis library from AQSENSE is subsequently used for range-map and point-cloud processing. This allows a 3-D reconstructed range map of the bone to be visualized in a number of different views (Fig. 2, bottom right).
Though not part of this system, the latest version of the SAL3D library, AQSENSE's 3DExpress 3-D preprocessing software demonstrated at the VISION 2012 tradeshow, allows these data to be exported to third-party imaging tools such as Sherlock from Teledyne DALSA (www.teledynedalsa.com). This allows measurements to be made on the 3-D dataset.
Vision Systems Articles Archives