3D robotic vision system measures plant characteristics
Determining the phenotype of plants automatically can be accomplished using a robotic vision-based system.
John L. Barron
Phenotyping is the process of measuring a plant's characteristics or traits, such as its biochemical or physiological properties. This comprehensive assessment of complex plant traits, characterizes features such as growth, development, tolerance, resistance, architecture, physiology, ecology, yield, and the basic measurement of individual quantitative parameters that form the basis for more complex traits. A phenotype depends on the plant's genetic code, its genotype, environmental factors and the interactions between the two.
While collecting phenotypic traits was previously a manual, destructive process; non-invasive, machine vision-based systems are now being deployed to perform the task. Such non-invasive systems enable researchers to accurately measure plant characteristics automatically, however, these systems do not require the destruction of the plant.
While two-dimensional (2D) image processing techniques have frequently been used to measure plant characteristics, such systems have inherent limitations. By acquiring images in 2D, it is difficult to measure three-dimensional (3D) quantities such as the surface area or the volume of a plant without performing error prone and potentially complicated and complex calculations.
To overcome these limitations, researchers in the Department of Computer Science at the University of Western Ontario (London, ON, Canada; www.uwo.ca) have developed an automated vision-based system for analyzing plant growth in indoor conditions.
Using an SG1002 3D laser scanner from ShapeGrabber (Ottawa, ON, Canada; www.shapegrabber.com) mounted on a gantry robot from Schunk (Lauffen am Neckar, Germany; www.schunk-modular-robotics.com), the system performs scanning tasks in an automated fashion throughout the lifetime of a plant. In operation, the 3D laser scanner captures images of the plant from multiple views. A 3D reconstruction algorithm is then used to merge these scans into a 3D mesh of the plant, computing its surface area and volume.
The system, including a programmable growth chamber, robot, scanner, data transfer, and analysis system is automated so that a user can start the system with a mouse click and retrieve the growth analysis results at the end of the lifetime of the plant with no intermediate intervention.
System hardware
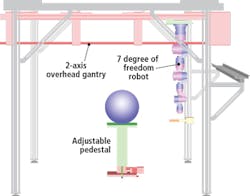
The Schunk robotic system comprises an adjustable pedestal and a two-axis overhead gantry that carries a seven-degree of freedom robotic arm. The plant to be analyzed is placed on the pedestal which can move vertically to accommodate different plant sizes (Figure 1). Both the position and orientation of the 3D scanner is controlled using the seven-degree of freedom robotic arm while the two-axis gantry provides a means to extend the workspace to accommodate different plant sizes.
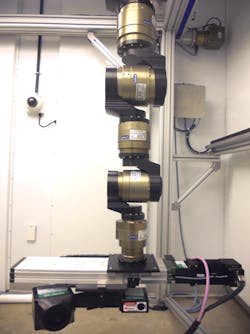
The robot is programmed to move in a circular trajectory around a plant and to take scans with an accuracy and repeatability of 0.1μm. As it does, the SG1002 ShapeGrabber mounted on the end-of arm tooling of the robot (Figure 2) captures thousands of accurate data points representing the surface geometry of the plant. The scanner then produces a point-cloud that consists of millions of closely packed 3D data points that consist of x, y and z coordinates of the surface.
The scanner uses near-infrared (NIR) wavelengths of 825nm. This particular wavelent is believed to produce minimal effects on plant growth while enabling the system to scan the plant regardless of whether it is in light or dark conditions.
Parameters of the scanner such as the field of view and laser power are set empirically. In experiments to capture images of dicot thale cress and monocot barley, a laser power of 1mW was used, providing a laser beam radius of 1mm. During the data acquisition process, it takes approximately one minute to scan and generate point cloud data.
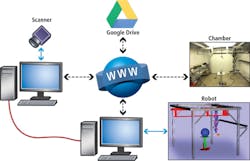
The robot and scanner are operated from different computers which communicate over a dedicated User Datagram Protocol (UDP) link. This architecture enables the scanner application to send messages to the robot controller, and the robot controller to send messages to the scanner application via an Internet Protocol (IP) network (Figure 3).
Each time the robot stops at a scanning position, the robot sends a message that instructs the SG1002 ShapeGrabber to take a scan. When the laser scan is complete, the scanner application software sends a message to the robot controller that instructs the robot controller to move the robot to the next position.
The 3D vision-based robotic system was built inside a growth chamber from BioChambers (Winnipeg, MB, Canada; www.biochambers.com). The growth chanber is equipped with a combination of 1220 mm T5HO fluorescent lamps and halogen lamps.
The growth chamber is fully programmable, allowing temperature, humidity, fan speed and light intensity to be controlled from the robot control software. Such communication between the growth chamber and the scanning schedule of the robot is vital when conducting experiments in different lighting conditions.
Scanning software
Before starting the experiment, grwoth chamber parameters are set according to the need of the particular application being performed. Before a plant is scanned, the robot controller communicates with the growth chamber, turns off the fan (and light if necessary), and then restores the default chamber settings after the final scan is completed.
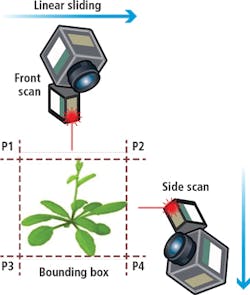
As the actual size or dimensions of the plant are not necessarily known in advance, determining the scanning boundaries needs to be performed dynamically during each scan. Moreover, as the plant continuously grows, it often may lean towards a one particular direction or another, which requires the scanner position to be adjusted accordingly.
To determine the scanning boundaries, a simple bounding box calculation is performed before each scan (Figure 4). The pre-scan procedure is performed from two directions.
From these scans, an approximation of the center of the plant is computed and the system then adjusts the gantry and robotic arm to translate and rotate the scan head to specified discrete positions.
At each scanning position, the system waits ten seconds to allow for residual plant and scanner motion to settle before initiating a scan. Once a scan has finished, the resulting scan data are analyzed to ensure plant data has been fully captured.
In the current setup, a plant is scanned six times a day from a total of twelve different viewpoints. These viewpoints result in overlapping range data between adjacent views, allowing multiple scans to be later aligned by a 3D reconstruction algorithm to obtain a single 3D triangular mesh that represents the whole plant.
Although a multiple view registration algorithm works well in aligning different scan data, registering two views with a large rotation angle difference can pose difficulties. The problem is more challenging for the cases of complex plant structures due to occlusion and local deformation between the two views. One approach to estimate the rough alignment of two views is depends on finding corresponding feature points. However, because of the complex structure of the plants, finding repeatable features tends to be challenging.
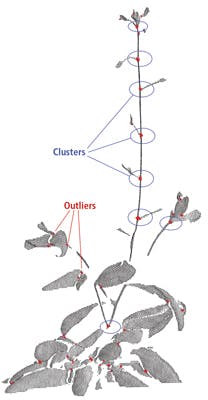
To address this problem, junction points of branches were ultimately used as feature points which were then matched with one another. However, this concept does not consider occlusion in leaves that can result in false feature point detection.
Fortunately, this issue can be overcome by using a density clustering technique to find groups of points on the junction branches that are denser than the remaining points, as true junction features tend to appear with higher density than false junctions. The clustering algorithm detects clusters around true junction points and discards the remainder of the points as outliers (Figure 5).
Once the aligned point cloud has been obtained from the multi-view data, it is triangulated to compute the mesh surface area and volume. Calculating precise values of area and volume enables the surface/volume ratio of the plant to be determined.
System effectiveness
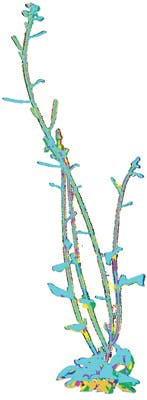
The system has been used to capture 3D images of the growth patterns of thale cress and the results were analyzed to highlight the diurnal growth patterns in both the volume and the surface area of the plants (Figure 6). From captured image data it was determined that the plant exhibited more growth at night time than in the day. The changes of volume of the plant was also greater than the changes of its surface area in the later period of the growth cycle.
The present automated vision-based phenotyping system is believed to be the first of its kind to obtain data over the lifetime of a plant using laser scanning technology.
It has been shown to be effective at comparing growth patterns of different types, varieties and species in different environmental conditions in an autonomous way.
In the future, the functionality of the system will be extended to study plants such as conifers. This is more challenging than phenotyping thale cress and barley due to the fine structure of conifer needles which are difficult to accurately reconstruct.
One of the reasons to measure this plant's growth would be to see if a diurnal growth pattern can be observed, since this is currently unknown.
Acknowledgments
The author would like to thank the following for their contributions and assistance in writing this article. Ayan Chaudhury, Mark Brophy, Norman Huner, Christopher Ward and Rajni V. Patel of the University of Western Ontario, Canada; Ali Talasaz (Stryker Mako Surgical Corp (Kalamazoo, MI, USA); Alexander G. Ivanov of the Institute of the Bulgarian Academy of Sciences (Sofia, Bulgaria) and Bernard Grodzinski, Department of Plant Agriculture, University of Guelph (Guelph, ON, Canada).
Profile
John L. Barron, Department of Computer Science, University of Western Ontario, (London, Ontario, Canada; www.uwo.ca).
Companies mentioned:
University of Western Ontario
London, ON, Canada
www.uwo.ca
Biochambers
Winnipeg, MB, Canada
www.biochambers.com
ShapeGrabber
Ottawa, ON, Canada
www.shapegrabber.com
Schunk
Lauffen am Neckar, Germany
www.schunk-modular-robotics.com
