Hyperspectral cameras measure consumer electronic display colors

Rapid improvements in the performance of display technology necessitates the need for better metrology tools to ensure the accurate rendering of color and uniformity.
Alexandre Fong and Mark Hsu
For many decades, low-cost, simple tristimulus filter spot imaging instruments performed the evaluation of the limited color gamuts of cathode ray tube (CRT) RGB monitors. The advent of four-color, LCD, OLED, and similar new technologies—in parallel with greater consumer awareness and expectations of performance—necessitates a need for more precise imaging instruments to perform such critical measurements.
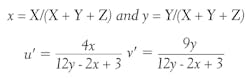
Color has traditionally been quantified in terms of various coordinate systems in a color map or space as defined by the International Commission on Illumination (CIE). The most common are x, y and u’, v’.These maps and their corresponding coordinates are derived from color matching functions based on human observers from experiments conducted in 1931 and 1976.1, 2
From RGB filter measurements, the coordinates can be computed subsequently from the map with simple algebraic equations:
High-performance spectroradiometers provided the much-needed improvement in accuracy by introducing color coordinates-based spectral measurements, since the color matching functions could be measured more accurately than filters, which only approximate the response. These can be treated as weighting functions from which the coordinates can be precisely computed:
However, such instruments are only capable of spot measurements unless physically scanned across the sample area with the aid of stages or robotic arms. This makes evaluation of spatial dependence of characteristics such as color uniformity difficult, time-consuming, and costly. Hyperspectral imaging offers a solution that combines the advantages of the ability imaging colorimeters to capture entire areas in a single measurement with the accuracy of a spectroradiometer.
The ‘hyper-cubes’ of data generated by hyperspectral imaging cameras represent the wavelength spectrum collected for each pixel in the image. Subtle reflected color differences that are not observable by the human eye or even by RGB cameras are immediately identifiable by a comparison of spectra between pixels.
Related: Hyperspectral imaging: Vision landscape expands with the rise of hyperspectral imaging technology
A variety of spectral imaging technologies exist. The most common type of hyperspectral imaging camera is the pushbroom system, whereby a line on the object plane generates a 2D pattern on an array sensor. The collection of a complete data cube (2D spatial x 1D spectral) requires mechanical scanning.
While the dispersing elements can be made small and each spectrum can be collected in as short as 1 ms, the mechanical motion makes these instruments somewhat bulky and prone to misalignment. Furthermore, increased spatial resolution comes at the expense of longer collection times.


Figure 1: HinaLea Imaging’s Model 4200 (top) and 4100H (bottom) are pictured.
Pushbroom grating systems were the earliest forms of hyperspectral cameras, initially developed by NASA, mounted on satellites and airborne platforms for research purposes.3
Band-sequential, front-staring, or snapshot imagers do not require mechanical scanning. Instead, a tunable filter that can sequentially select spectral bands is placed in front of the sensor and generates the hyper-cube by collecting complete images at each spectral band. The acquisition time does not depend on the number of pixels, but rather on the number of spectral bands being acquired. These imagers are especially attractive for applications requiring high spatial and spectral resolutions with tunable spectral ranges and a small form factor.
Related: Handheld hyperspectral imaging camera measures crop health
By controlling the reflectivity of the mirrors and their spacing in a classic Fabry-Perot interferometer (FPI) configuration, high-finesse spectral filtering can be achieved. HinaLea Imaging (Kapolei, HI, USA; www.hinaleaimaging.com) is the first company to incorporate this FPI-based filtering configuration in a battery-operated, handheld staring hyperspectral imaging camera, which can capture multi-megapixel images in 550 spectral bands in as little as two seconds.
Because the embedded hardware in the camera enables real-time data processing, large data sets typically generated by hyperspectral systems are avoided. Rather, the camera can identify features of interest—both in the spectral and spatial domains—and classify these features in the image.4
Unlike other band-sequential imagers that incorporate costly, power-restrictive acousto-optic tunable filters (AOTFs) or liquid crystal tunable filters that can suffer from poor reproducibility, the FPI technology is easily configured for laboratory benchtop investigations or production line testing.
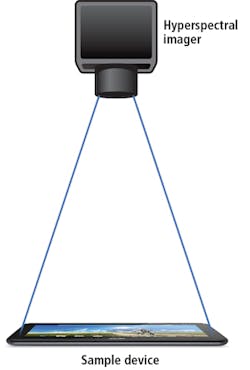
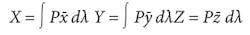
Figure 2: The hyperspectral imaging camera configuration for display color measurement is displayed here.
Example of color measurement of tablet and smartphone display
A series of data cubes of consumer electronic displays were captured using a HinaLea Imaging VNIR hyperspectral camera (Model 4200) configured as per Figure 2. A color tile test pattern was displayed on the devices, spectra for randomly selected regions of interest were averaged (5 spectra per) and the chromaticity coordinates computed. Figure 3 shows the results from a smartphone and tablet device from the same manufacturer. Both are AMOLED (Active Matrix Organic LED) displays but likely from different manufacturers.
Figure 3: Pictured in this image are sample AMOLED cell phone and tablet displays.
For evaluation of the color, it is the relative spectral shape, not the intensity from which the coordinates are computed, so the latter should not be considered in this discussion. Examination of the spectra for the red, blue, and green tiles, and white regions, clearly shows differences between the resulting spectra for each.
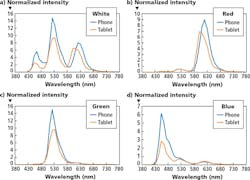
Figure 4 (a, b, c, d): Comparison of averaged spectra for sample areas of white region, red, green, and blue tiles displayed on cell phone and tablet is shown here.
All four regions sampled show distinct differences, but it is most notable in the red and blue components. The summary table (Figure 5) of computed chromaticity coordinates bears this out. This is subsequently evidenced in the white, which is a composite of the three-color components. Such differences might not otherwise be detected or identified with conventional filter methods and indeed it is likely, given that these devices are from the same manufacturer, that the current metrology instruments employed were unable to make such distinctions.
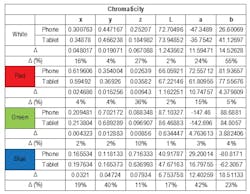
Figure 5: A comparison of chromaticity coordinates computed from averaged spectra for sample areas of white region, red, green, and blue tiles displayed on cell phone and tablet is tabulated here.
It’s interesting to note that this has impact on the color gamut, or range of colors the device is measured to yield as mapped on the color space. (Figure 6).
Summary
In addition to spatial information, by identifying distinctions in images which are not only invisible to the eye but also to color (RGB) cameras and even imaging colorimeters, hyperspectral imaging cameras can provide more accurate and rapid assessment of display product color metrics.
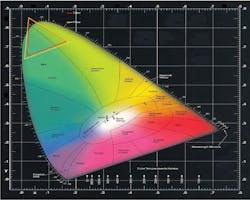
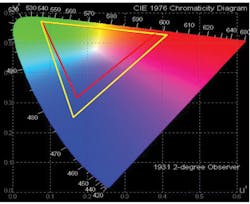
Figure 6: Tabulate comparison of resulting gamuts for the chromaticity coordinates computed from averaged spectra for sample areas of white region, red, green and blue tiles displayed on cell phone and tablet is presented here.
In the examples discussed, the HinaLea hyperspectral imaging system was able to detect spectral differences that had significant impact on color differences between two product displays from the same manufacturer.
Due to portability and the ability to dynamically change spectral range and band-pass capability, the HinaLea hyperspectral imaging technology enables the configuration of the same instrument for a variety of parameters and points of interest during the inspection stage, to both optimize accuracy and reduce the time to capture the image.
References:
1. CIE 1931 color space, https://en.wikipedia.org/wiki/CIE_1931_color_space
2. CIELUV, https://en.wikipedia.org/wiki/CIELUV
3. C. H., Poole, G. H., Parker, P. E. and Gottwald, T. R. (2010) ‘Plant Disease Severity Estimated Visually, by Digital Photography and Image Analysis, and by Hyperspectral Imaging’, Critical Reviews in Plant Sciences, 29: 2, 59 — 107, DOI: 10.1080/07352681003617285, http://dx.doi.org/10.1080/07352681003617285
4. Hod Finkelstein, Ron R. Nissim and Mark J. Hsu, TruTag Technologies Inc., “Next-generation intelligent hyperspectral imagers”.
Alexandre Fong, director of hyperspectral imaging and Mark Hsu, director of product development, HinaLea Imaging (Kapolei, HI, USA; www.hinaleaimaging.com)