Motion-based vision system
Motion-based vision system
By Yair Kipman
Printer manufacturers are beginning to use machine-vision systems to evaluate image print quality and set quality-control standards. When performed manually, this inspection is time-consuming, labor-intensive, and stressful. To automate the inspection process, objects as small as 10 µm must be measured at different locations on a document. At the same time, the dimensions of the entire document must be checked.
There are many disadvantages to using page scanners for digitizing images in inspection applications. According to Nyquist theory, the sampling frequency of scanners should be at least twice the frequency of the features being examined. If a printer produces 600-dpi images, the scanner must resolve at least 1200 dots per inch. High-resolution linear scanners also introduce the start/stop problems that result in pixel-related errors. In linear scanners, one bad pixel can also affect entire scanned columns. In contrast, by using area-array charge-coupled device (CCD) cameras, single bad pixels do not affect columns of image data.
To acquire the few regions of interest required by scanner-based systems, complete pages need to be digitized. But digitizing complete images is time-consuming and requires large data-storage capabilities. Because only 15% of the print area needs to be digitized for later analysis, print-inspection systems are more effectively built around motion-based systems using array CCDs. Such systems acquire images by moving area-array-based cameras over an image positioned on an x-y table. By doing so, the amount of storage required for image analysis is reduced, the problems of scanner-based analysis are alleviated, and there is a faster, more cost-effective means of print analysis.
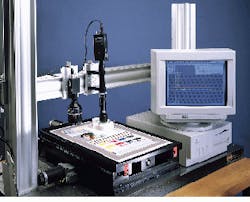
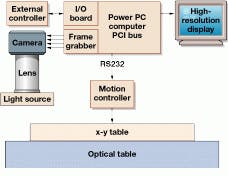
Such a system, ImageXpert from KDY (Nashua, NH), is composed of off-the-shelf imaging components and customized image-processing software tailored for print analysis. Prints are held on an x-y table from New England Affiliated Technology (Lawrence, MA) located on top of a Newport (Irvine, CA) vibration-isolation table (see Fig. 1). Using the system, images of 640 ¥ 480, 1024 ¥ 1024, or 2048 ¥ 1 (linescan) can be captured. Color images of 640 ¥ 480 are captured using a Sony (San Jose, CA) solid-state camera interfaced to a Scion (Frederick, MD) PC-based frame grabber. Images of 1024 ¥ 1024 and 2048 line-scan images are captured with Dalsa (Waterloo, Ontario, Canada) CCD cameras interfaced to a Bitflow (Billerica, MA) PC-based frame grabber.
Image Analyst software from Acuity Imaging (Nashua, NH) was used to develop the application. An I/O interface card communicates with external devices to allow incorporation of devices such as document feeders. A motion controller connected to the RS232 serial port allows the x-y table to be controlled at different resolution and sizes.
Both Sony and Dalsa cameras support two different lens types. The first, with a field of view (FOV) of 1 to 6 mm, is used to measure dot quality, dot placement, or color registration. The other, with a FOV of 10 to 30 mm, measures print dimension and color consistency. Each lens has a focusing mechanism and iris. A high-frequency fluorescent lens and a halogen lamp with fiberoptic light guide illuminate the document under inspection.
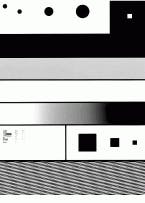
In operation, the system automates the analysis of print quality on standard test targets. These targets provide test patterns from which dot quality, streak analysis, line quality, sharpness, and resolution can be made. Figure 2 shows a typical test target and highlights the regions of interest for such analysis.
As a menu-driven program, the system offers image processing, analysis data collection, and reporting tools. Live video can be captured or stored images can be used for testing and calibration. Data and images also can be stored for use by other programs; results are reported in a spreadsheet that can be compared to user-defined pass-fail tolerances or used for statistical analysis.
Interactive analysis
Two distinct methods are used to analyze an image. Interactive analysis provides the operator with graphical interface tools to manually interact with the image during analysis. Automatic analysis creates a macro-like sequence of image-analysis steps that can be repeated with a single keystroke. A sequence of instructions can be built to enhance feature appearance, count objects, determine density, shape size position and movement, perform object feature extraction, and conduct textural analysis.
Algorithms include area, connectivity analysis, edge analysis, gray-scale analysis, vector analysis, Hough transform, morphology, correlation, enhancement, and image arithmetic. All of these algorithms operate within a user-defined region of interest (ROI) that can be as small as a single pixel or as large as the whole image.
A task editor incorporates motion capability into the system. This allows sequences of operations (task lists) to be created via pull-down menus. Using the editor, a list can be constructed that includes motion commands, vision commands, input/output (I/O) commands, and flow control (for loops and conditionals). To construct imaging applications, these inspection sequences can be trained and run automatically.
When dimensional-accuracy measurement of a large-format target is required, extended FOV has to be used. In such cases, the four corners of the target are not within one FOV, and the x-y table must be moved to each corner of the image and separate images captured and measured.
In print-inspection applications, the field of view of the camera could be as small as 1 mm. This translates to about 2 (m per camera pixel. If a page is not placed properly on the x-y table, the feature to be measured will not be within the field of view. To compensate for this misplacement, dynamic image location accommodates image misplacement.
Testing image quality
Image quality on printed material can be measured by studying various aspects of the printed image. These include dot and line quality, uniformity, and sharpness.
Dot quality can be assessed by measuring the number of dots within a specific field of view. A decrease in the number of dots in a given image can occur when some dots are not printed or two dots collapse to create a larger dot. Increase in the number of dots can occur when satellites appear. To analyze print dots, ImageXpert provides algorithms for area, axis, ratio, and roundness measurement (see Fig. 3). These results can be output to analysis packages for further examination.
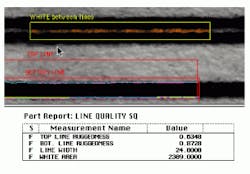
Line quality on a printed image is affected by raggedness, line width, and sharpness. Ragged edges are the results of dot-placement error combined with ink interactions with the printed paper. Linewidth raggedness is the displacement of the line`s black and white boundary from its ideal base line and describes how ragged the edge appears. This value is calculated by determining the average deviation in pixels of the points where the transition occurred and the best edge that describes those points (see Fig. 4).
The largest contributor to nonuniformity is ink quality. If there is any inconsistency in the amount of ink or paper quality, printer-uniformity specifications will not be met. To test for this, ImageXpert compares the gray-level average in any number of locations in the horizontal direction of a printed target image. The test calculates the differences in the gray level for any two regions and compares the result with tolerances that are user-specified.
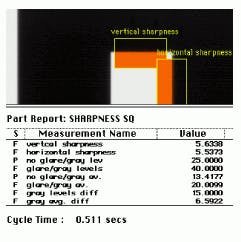
Risetime is a measure of image sharpness. In a blurred image, transitions from black to white occur over a large number of pixels. In a sharp image, the number of pixels in the transition region is minimized. To measure sharpness, ImageXpert measures the risetime/sharpness in the horizontal and vertical directions of the edges in the printed image (see Fig. 5).
With increased use of automated image-quality-analysis tools, printer manufacturers can insure more consistent output quality. And, they can implement quality-control procedures to monitor the performance of printer manufacturing.
Print inspection is one of the target applications for this PC-based inspection system.
FIGURE 1. ImageXpert from KDY Associates is a PC-based print-quality inspection system. By using up to four cameras mounted on an x-y table, the system locates and analyzes images from printer test targets without needing to digitize complete A3 images at high resolution.
FIGURE 2. Calibration on test targets allows automated test systems to rapidly locate areas of interest from which dot, line, streaks, sharpness, and resolution qualities can be made.
FIGURE 3. To analyze print dots, ImageXpert provides morphological algorithms for area, axis, ratio, and roundness measurement. In this application, measurements are taken that can be fed to a spreadsheet for later analysis.
FIGURE 4. Ragged line edges result from the displacement of the line`s black and white boundary from its ideal base line. To determine how ragged a line is, ImageXpert determines the average deviation in pixels of the points where the transition occurred and the best edge that describes those points.
FIGURE 5. In a blurred image, transitions from black to white occur over a large number of pixels. In a sharp image, the number of pixels in the transition region is minimized. To measure sharpness, ImageXpert measures the risetime/sharpness in the horizontal and vertical directions of the edges in the printed image.
