Researchers focus ray-tracing techniques on contact-lens design

Researchers focus ray-tracing techniques on contact-lens design
By Dave Wilson
Of the elements that make up the human eye, the cornea (the fibrous tissue forming the front surface of the eye) refracts light the most. For this reason, the cornea`s shape substantially affects the quality of human vision. Professor Brian A. Barsky of the University of California at Berkeley (Berkeley, CA) became interested in modeling the cornea after learning that slight distortions in his own cornea were causing him vision problems. This situation led to the OPTICAL (OPtics and Topography Involving Cornea And Lens) project, which provides a way to model contact lenses using computer hardware and software.
In contact-lens design, optometrists sometimes use a videokeratograph to measure the shape of the eye. In operation, a cone painted with alternating black and white rings is projected onto the patient`s cornea, and a distorted image of the rings is captured by a video camera (see Fig. 1). This technique produces numerical information related to curvature that describes the shape of the eye.
Although effective, this technique fails to capture subtle characteristics about the shape of the cornea. This is due, Barsky says, to oversimplifications in the parameters being computed and the reconstruction algorithms used. "The curvature parameters measured do not take into account the position of the eye relative to the instrument," says Barsky. Therefore, the results obtained by the machine vary, depending on the orientation of the eye when the videokeratograph makes its curvature measurements. "Because one of my eyes has a maximum curvature that is not in the center, when I look at the conventional videokeratograph in two different directions, the results obtained differ widely," states Barsky.
By creating more accurate cornea shape information, Barsky and his fellow researchers at Berkeley are striving to create better contact lenses for patients with severe eye problems. Obtaining more accurate cornea-shape information could also help improve the results of surgical methods, such as radial keratotomy (slicing the cornea to change its shape) and photorefractive keratectomy (ablating the cornea with a laser).
To obtain an accurate shape representation for the cornea, Barsky`s group has developed a means of simulating the results obtained by the videokeratograph (see Fig. 2). After the cornea`s ring pattern is digitized by the video camera, a backward ray-tracing algorithm simulates the arrangement of the reflected ring pattern. Starting with a spherical cornea, the shape of the eye is iteratively distorted until the reflected pattern in the simulation matches the distortion in the ring pattern captured by the instrument`s video camera.
In the image from the videokeratograph simulator, light rays emanate from the rings of light, bounce off the front of the cornea, pass through the lens, and fall on the image plane of the video camera (see Fig. 3). In the backward ray-tracing process, rays of light start at the image, pass through the lens, and bounce off the cornea. The algorithm checks whether the rays hit the rings of light. If they do not, the software adjusts the shape of the cornea and continues to operate until all the rays have hit the rings of light. The imaging system can save this information into a file with the same format as that created by the videokeratograph.
The output of the simulation is a color map that shows the curvature over the shape of the cornea. Patterns causing astigmatism are visible with the aid of the color map. Files generated from the videokeratograph simulator are read and displayed by visualization software (see Fig. 4). The imaging system can display optic power (measured in diopters) as a two-dimensional image or as a color-coding on top of three-dimensional (3-D) data. It can also shade the 3-D data and take a cross section of the data.
A shortcoming of conventional displays used to measure the power (in diopters) of the cornea is that, because the curvature of the cornea is calculated radially, there is an inherent singularity in the center of the data. Barsky`s group has addressed this problem with a technique developed for the visualization of shape information. Data are color-coded based on the average of the maximum and minimum curvatures (Fig. 5, left) and the difference of the maximum and minimum curvatures (Fig. 5, right). The advantage of this technique is that these quantities are continuous in the center and do not depend on an arbitrarily chosen "center" of the data about which to calculate curvature.
Making contact lenses
Another software program, a fluorescein simulator, replicates the results of the traditional techniques in which a clinician places a contact lens of known dimensions on the patient`s eye, applies a fluorescein dye, and shines a blue light on the lens. The fluorescein forms a pattern in which brightness is related to the distance of the lens from the cornea (see Fig. 6).
The Berkeley algorithm has been run on both synthetically generated data sets and real data. In synthetically generated data, a positional accuracy of 0.013 mm has been achieved. However, accuracy information on the data from a real cornea could not be generated because the true shape of the cornea was un known.
Figure 7 shows frames generated by running the algorithm on synthetically generated data to simulate keratoconus, a corneal condition in which there is a local region of high curvature. The surface is generated from a sphere with a rotationally symmetric bump mathematically grafted on to it. The bump and the sphere meet with curvature continuity. Curvature at the peak of the bump is greater than the curvature of the sphere. This situation has not been handled well by existing measurement techniques because of oversimplified approaches. But the Berkeley algorithm has no difficulty in finding an accurate solution.
Teleradiology software
In the project`s next stage, researchers aim to perfect televisualized software, which will allow clinicians and researchers to share patient data. All interested parties would have access to the same visualization tools as if they were in the same room. A mock-up prototype application, called LensNet, has been demonstrated (see Fig. 8).
In operation, the clinician would load a patient`s data into the system. These data would then be mirrored to a distant system. Next, the system would load the corneal map (Fig. 8, upper left) and the Gaussian curvature map (Fig. 8, lower left). Clinicians, consultants, and contact-lens manufacturers would then create a new contact lens using the program. Clinicians could also discuss how the lens would fit on the cornea until they were both satisfied with the design. Then, the clinician could choose to save the lens in a file format compatible with the particular manufacturing equipment used.
For more imformation, contact Prof. Barsky at Computer Science Division, University of California, Berkeley, CA 94720-1776; e-mail: [email protected].

FIGURE 1. To measure the shape of the eye, a videokeratograph (VK) projects a cone painted with alternating black and white rings onto the patient`s cornea, and a distorted image of the rings is captured by a video camera. This technique produces numbers related to curvature that describe the shape of the eye.
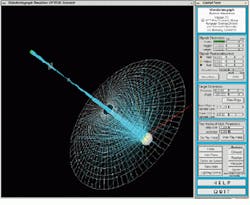
FIGURE 3. An image from the videokeratograph simulator highlights the backwards ray-tracing technique. In the backwards ray-tracing process, rays of light start (cyan lines) at the image, pass through the lens, and bounce off the cornea (ellipsoid on the right). The algorithm checks whether the rays hit the rings of light (white mesh). If they do not, the software adjusts the shape of the cornea and continues until all the rays have hit the rings of light.

FIGURE 2. Once the ring pattern is captured by a video camera, a backward ray-tracing process simulates the arrangement of the cornea and the camera. Starting with a spherical cornea, the shape of the eye is iteratively distorted until the reflected pattern in the simulation matches the distortion in the ring pattern captured by the instrument`s video camera.
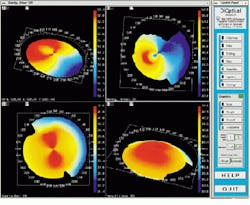
FIGURE 4. Files generated from a videokeratograph or videokeratograph simulator are read and displayed by visualization software. The imaging system can display optic power (measured in diopters) as a 2-D image (upper left) or as a color-coding on top of 3-D data (upper and lower right). It can also shade the 3-D data and take a cross section of the data (lower left).
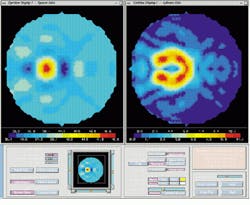
FIGURE 5. If the curvature of the cornea is calculated radially, an inherent singularity emerges in the center of the data. This problem has been addressed by color-coding data based on the average of the maximum and minimum curvatures (left) and the difference of the maximum and minimum curvatures (right). These quantities are continuous in the center and do not depend on an arbitrarily chosen "center" of the data about which to calculate curvature.
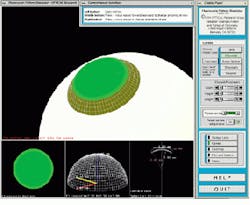
FIGURE 6. A fluorescein simulator postures the results of the traditional technique in which a clinician places a contact lens of known dimensions on a patient`s eye, applies a fluorescein dye, and shines a blue light on the lens. The fluorescein forms a pattern in which brightness is related to the distance of the lens from the cornea. The sclera of the eye is shown as a white surface, the cornea as a white mesh, and the contact-lens fluorescein pattern as green. The smaller subwindows depict a top-level view of the pattern, a 3-D mesh of the contact lens shape, and the specific contact lens parameters.
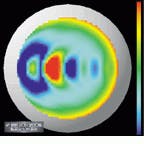
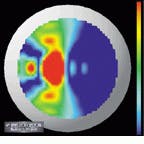
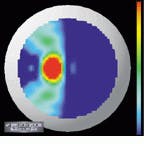
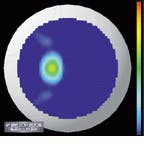
FIGURE 7. Frames are generated by running the software algorithm on synthetically generated data to simulate keratoconus, a corneal condition in which there is a local region of high curvature. The surface is generated from a sphere with a rotationally symmetric bump mathematically grafted onto it.
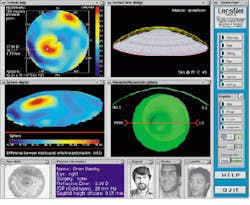
FIGURE 8. The Berkeley researchers foresee the time when tele-visualization software will allow several people, such as a clinician and a researcher, to simultaneously share data describing the design of a contact lens, and to access the same tools as if they were in the same room. Shown here is a mock-up prototype application called LensNet. The two video-teleconferencing windows are shown in the lower, the four visualization windows fill the majority of the screen, and the control panel is at the right.
DAVE WILSON is a science writer in London, England.
Solid-state camera speeds retinal imaging
Using conventional techniques, ophthalmologists examine the retina with a pair of lenses called an indirect ophthalmoscope. However, this instrument allows the retina to be visualized only 15 at a time. Therefore, ophthalmologists must integrate this information mentally to form a picture of the entire retina.
Retinal cameras have been developed that can image a wider field, but they still only image at most 50 in a single exposure. To obtain an even wider view, images are obtained at various angles, and the ophthalmologist cuts and pastes these images together.
Various companies have improved their existing retinal cameras by adding CCD imagers, but these are expensive and difficult to use. Now, Massie Research Laboratories (MRL; Pleasanton, CA) has developed an alternative solid-state camera. The RetCam 120 is a palm-sized, fully digital, high-resolution retinal camera that can capture 120 of the retina, as measured from the center of the eye, in a single image. An existing film-based hand-held camera would require more than 30 separate images to be pasted together to provide an image of the same size as that taken by the RetCam 120 (see Fig. 1).
To operate the camera, a small lens at the tip of the camera handpiece is placed onto the patient`s eye (see Fig. 2) after the application of a topical anesthetic. Imaging of the eye is then conducted in a fashion similar to that of current ophthalmologic ultrasound systems. A real-time image of the retina is captured using a frame grabber, from which it can be displayed or stored on a writeable compact-disk system.
Most retinal cameras provide little or no astigmatic correction. Yet, as little as 0.5 diopter of astigmatism reduces the resolution of an image by one-third. Because the RetCam 120 touches the eye in use, all such aberrations are removed. Moreover, the depth of focus of the camera is large, accommodating the imaging of physically large objects such as retinal tumors.
In operation, a fiberoptic cable brings light into a ring at the end of the rear housing of the camera to inject light into the eye. A similar ring in the nosepiece captures the light. The nosepiece is detachable, allowing changes in the magnification of the optical system. The fiber itself is terminated with a "diffuser," a tiny cylindrical optic with a shape that distributes the light exactly onto the periphery and the center of the eye.
Maintaining accurate color and image resolution is important, so conventional CCDs could not be used in the camera design. Because these cameras are sensitive to light from all colors in the visible spectrum, vision-system designers usually place a color mask over the CCD to identify pixels as either red, green, or blue. However, if the pixels are split equally among these three colors, the resolution of the color CCD becomes one-third that of a monochrome camera. As a result, and because most images contain a great deal of information in the green region, most color-CCD integrated circuits are masked with a pattern of green, green, red, green, green, blue. This arrangement works well for conventional images, such as landscapes, with the result that the eye perceives the resolution in the green region as two-thirds that of the monochrome camera.
However, this approach is unsuitable for retinal imaging, where red hues dominate and the resolution in the red region is reduced to one-eighth that of a monochrome camera. As a result, MRL uses a Toshiba three-chip camera that incorporates a prism to split the light captured from the nosepiece ring into red, green, and blue beams. Individual CCD imagers are then used to detect each color. The output from the CCDs are then sent to a frame-grabber board from which the signals can then be processed, displayed, and stored.
To facilitate operation, the system`s image database allows the operator to retrieve images by attributes. Furthermore, because the system has an external image-capture port, ultrasound images of the eye can be captured and displayed beside the optical image to aid in clinical assessments. Lastly, the system enables images to be e-mailed to remote locations.
Dr. Bert Massie
Massie Research Laboratories
5653 Stoneridge Drive, Suite 102
Pleasanton, CA 94588
E-mail: [email protected]
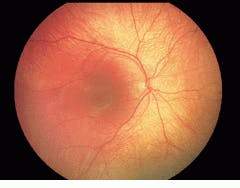
FIGURE 1. Existing film-based hand-held cameras require more than 30 separate images to be pasted together to provide an image of the same size as that taken by the RetCam 120 solid-state camera.
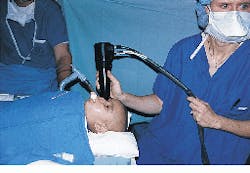
FIGURE 2. A small lens at the tip of the camera handpiece is placed onto the patient`s eye after the application of a topical anesthetic. Imaging of the eye is then conducted in a fashion similar to that of current ophthalmic ultrasound systems.