PHARMACEUTICAL: High-speed video quantifies drug delivery performance
After purchasing Advanced Inhalation Research (AIR; Cambridge, MA, USA) a decade ago, Alkermes (Cambridge, MA, USA; www.alkermes.com) inherited the company’s pulmonary drug delivery technology that is used to treat respiratory diseases. Small-molecule or macro-molecule drug particles are administered to the patient when the patient inhales through the mouthpiece; this draws air drawn into an aerosol chamber that agitates a capsule to release dry powder medicine.
To optimize these inhaler designs, Alkermes has developed a vision system to analyze the capsule using a range of airflows designed to represent patients of different ages. In addition to measuring the amount of powder delivered through the mouthpiece, the system also quantifies the capsule’s motion inside the inhaler.
Since the capsule moves rapidly, a high-speed video system was used to capture the capsule’s motion and MATLAB from The MathWorks (Natick, MA, USA; www.mathworks.com) was then used to analyze the images off-line. By evaluating the position of the capsule on a frame by frame basis, the linear and rotational motion, velocity, acceleration, and momentum of the capsule can be computed and the physical factors influencing the inhaler’s performance can be evaluated.
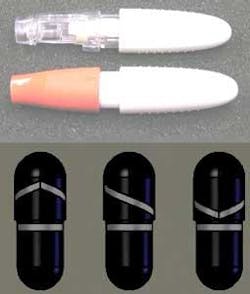
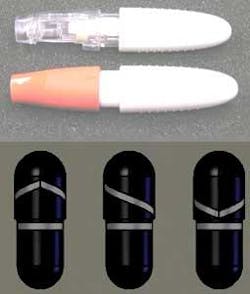
Inhalers with clear plastic components were developed so the capsule would be visible inside the aerosol chamber. To allow captured images to be processed automatically, capsules were marked with both an equatorial line and a slanted line that produces a saw-tooth pattern as the capsule rotates (see Fig. 1).
During each 1.5-s test, 15,000 256 × 256-pixel grayscale images were captured at 10,000 frames/s using a Phantom camera from Vision Research (Wayne, NJ, USA; www.visionresearch.com). To assess the motion of the capsule inside the inhaler, the angle of the equatorial line for each video frame was analyzed and the resulting sinusoidal signal used to determine the amplitude and frequency of the capsule’s wobbling motion. By counting the peaks of the continuous saw-tooth pattern, captured while the capsule was rotating, the rotational angular motion of the capsule was determined.
In the experiments, the capsule and inhaler were placed in several different orientations, ranging from horizontal to vertical, upright, and inverted. For image analysis, video frames were rotated so the capsule always appeared in a vertical orientation, with the equatorial line positioned below the slanted line. After reorienting the video data, each grayscale image was thresholded to produce a binary image and smaller areas produced by noise and glare eliminated, leaving images of the equatorial and saw-tooth lines (see Fig. 2, left and center).
Once the objects of interest were identified, a least squares fit algorithm was used to compute a straight line through the equatorial line on the capsule and the endpoints and midpoint of the line. A perpendicular line was computed from the midpoint of the equatorial line to the midpoint of the slanted line. This resulted in a measure of the distance between the equatorial and saw-tooth lines along the major axis of the capsule.
As the capsule moves in the aerosol chamber, the midpoint of the least squares fitted line is used to track capsule position. The angle of the least squares fitted line is used to track capsule wobbling and the peak values in the distance between the equatorial and slanted line used to track capsule rotation (see Fig. 2, right).
After the coordinates of the midpoint, distance between equatorial and saw-tooth lines, and angle of the equatorial line for each frame were stored in an Excel file, frame-to-frame displacement of the equatorial line’s midpoint and the coordinates of the midpoint was measured. Dividing displacement by the time between frames provided the capsule velocity; changes in velocity between frames provided the capsule acceleration. Power, momentum, and impulse were also calculated based on these values.
Using MATLAB’s Signal Processing Toolbox, a power spectral density was computed from the equatorial line orientation data to identify the dominant frequencies of the capsule’s wobbling motion.
Once the image analysis and output data post-processing algorithms were defined, a GUI was developed to record information about the test and the inhaler orientation, test flow rate, and inhaler type.
Alkermes has already gained insight into how the capsule moves within the inhaler and has correlated experimental variables such as flow rate, to a variety of quantifiable features of the capsule motion. The objective is to identify aspects of the capsule motion that determine the amount, rate, and distribution of powder delivery to optimize future inhaler designs.


