Imaging system maps genetic patterns
By C. G. Masi,Contributing Editor
Microarray experiments allow biotechnology researchers to look at massively parallel lines of genetic information by printing spots of complementary DNA (cDNA) onto a slide and using these spots to bind genetic material expressed in living tissues. Each cDNA spot is designed to bind exclusively to a particular DNA base sequence coding for a particular gene.
An important class of microarray experiments used in biotechnology research compares the DNA extracted from a tissue that has been experimentally manipulated (for example, by taking it from an animal experimentally exposed to a prototype drug) to a control DNA extracted from a tissue that has not been manipulated. If, for example, the experimental conditions increase the rate at which a given gene is expressed, then there will be more DNA with that sequence available to bind with the corresponding cDNA spot on the microarray.
Fluorescent tags are a popular means of measuring relative expression rates in this type of microarray experiment. To use them, researchers label the experimental DNA with a red-emitting fluorophore, such as Cy5 Amidite from Amersham Pharmacia Biotech (Piscataway, NJ). The control DNA is labeled with a fluorophore emitting in the green spectral region (Cy3 Amidite). Spot binding a gene whose expression is enhanced under the experimental conditions will appear red, whereas spot binding a gene whose expression is repressed will appear green. A spot whose gene is unaffected by the experiment will appear yellow.
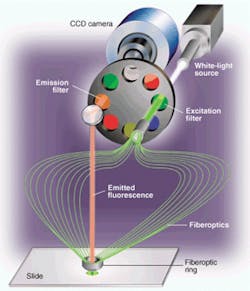
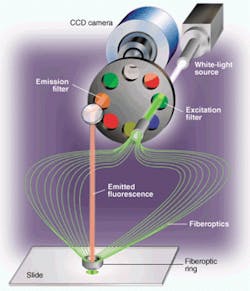
FIGURE 1. Microarray scanner incorporates a filtered white-light source for fluorescence excitation and a CCD array camera for imaging. Having a filtered white-light source allows researchers greater freedom in selecting fluorescence tags and combining multiple tags on one microarray. Capturing the image with a CCD camera improves throughput, increases exposure time on each spot, and eliminates misregistration problems.
Researchers using this technique are looking at interactions of gene expression across a large variety of genes tested by one microarray at the same time. They want to see which genes are changing and look at patterns of genetic expression, that is, groups of genes that tend to work together in a particular pattern.
Acquiring fluorescence images
Applied Precision (Issaquah, WA) used its expertise in building high-precision semiconductor-fabrication equipment to develop a novel scanning system (arrayWoRx) for reading out these microarrays (see Fig. 1). This system uses a CCD camera to acquire high-resolution multiple images of a DNA microarray slide. It images the entire slide in sections, called panels, by moving the slide underneath the optics. The light source is a 250-W metal-halide bulb that shines through a mechanical shutter to deliver an accurate exposure for each panel. An excitation filter in a filter wheel selects a narrow wavelength band that will efficiently pump optical energy into fluorophore molecules bound to the DNA samples.
Each fluorophore tag has a different excitation wavelength and fluoresces at a different wavelength, as well. Because at least two different tags (a control and at least one experimental tag) are used in each experiment, the filter wheel has to present at least two pairs of filters matched to the excitation and emission wavelengths of the two tags. The arrayWoRx filter wheel has space for up to four such filter pairs, making it possible to apply a control tag and up to three different experimental tags.
FIGURE 2. Panelization allows researchers to cover the entire microarray active surface using an optical system with reasonable specifications. The small panel size is selected so that each 150-µm cDNA spot on the microarray covers about 80 pixels on the 0.25 million-pixel CCD array. At the same time, about 64 spots appear in each panel, which provide enough parallelism for good throughput. Imaging a whole two-dimensional panel at a time helps prevent misregistration problems by allowing the microarray to stay stationary during the switching between fluorescence channels. (Photo courtesy of Applied Precision)
A bundle of fiberoptic lightguides carries the excitation light from the excitation filter to the microarray. There are 19 fibers in the bundle. The light source focuses the excitation light onto one end of the fiberoptic bundle. The other end of the bundle forms a ring light that surrounds and attaches to a standard microscope objective.
Along the ring, the fibers are angled so that they deliver excitation light to the center of the objective's field of view. The angle of illumination (approximately 45°) is set up so that the reflection from the slide's surface falls outside the objective's cone of collection. Fluorescence emitted by the microarray target spots comes out in all directions. The amount that falls within the objective lens' numerical aperture of 0.2 is collected. This high-quality lens uses an off-the-shelf microscope objective.
FIGURE 3. Microarray scanner's host computer is a RISC-processor-based workstation capable of controlling image acquisition, stitching together image panels, analyzing the data, and presenting the results. Additional software features include help with keeping track of what genes are represented on which microarray spot and evaluating the quality of data being developed in each microarray experiment.
A front-surface mirror above the objective bends the optical axis through 90° to pass fluorescence light back through an emission filter mounted diametrically opposite the excitation filter on the filter wheel. The emission filter selects out the emitted fluorescence wavelength, blocking any bleed-through of the excitation wavelength and other extraneous light.
The objective lens forms an image of the fluorescing microarray spot onto a two-stage-cooled, 14-bit CCD imaging array. This custom-built detector offers a linear response, high sensitivity, and a quantum efficiency between 50% and 65%. It also has a wide spectral range of sensitivity, which gives researchers wide latitude in selecting custom fluorophore combinations.
The camera images the microarray in panels that are about 2.25 mm square (see Fig. 2). It uses a Kodak KAG-series chip and delivers about 250,000 pixels per frame at a resolution of 512 x 512 pixels and a 79-dB dynamic range. The image-acquisition rate is read-and-sample limited, with about 70 ms for the shortest exposure time. The cDNA spots are typically about 150 µm in diameter and about 350 µm apart. There are usually about 40-50 spots within a single panel, providing adequate sampling across each spot for quality-control statistics.
Since the significant measurement result for each cDNA spot is the ratio of red to green fluorescence, it is important that the misregistration of images in different wavelengths be held to less than a pixel width. The arrayWoRx scanner achieves this level of precision in two ways: optically and mechanically.
The optical system uses an apochromatic objective lens that is precisely corrected at all visible wavelengths. Since the image it produces is similarly independent of wavelength, the image of a pixel imaged using red fluorescence falls on the same CCD element as the image of the same pixel imaged using green fluorescence.
The mechanical system is arranged so that nothing moves between wavelength changes except the filter wheel. The optical system remains fixed. Shifting from panel to panel is done by moving the microarray rather than moving the microscope. Once a panel is brought under the objective's field of view, the positioning stage stops while the filter wheel and the CCD camera cycle through and take images at all the required wavelengths. Next, the stage moves to bring the next panel under the objective and then stops again. The system acquires images of that panel using all the required filters before the stage moves again.
Software is key
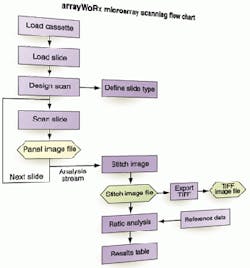
Stitching the panels together is done in postacquisition mode using software running on a host computer. The arrayWoRx host is a Silicon Graphics Computer Systems (Mountain View, CA) O2 workstation powered by an R5200 64-bit RISC processor capable of 1 MIPS. It runs the company's UNIX-based Irix 6.5 operating system and incorporates a 9-Gbyte hard drive capable of storing more than eight hours of scans. This scanning host system loads, reads, and analyzes the microarrays (see Fig. 3).
The job of stitching panels together is made easier by accurately positioning the microarray for each panel's image acquisition. The stitching algorithm relies on stage positions measured at the time each panel image is acquired to calculate relative positions. If it simply places the panels edge-to-edge, cumulative errors could make identifying cDNA spots difficult.
As with most machine-vision systems, illumination is critical for acquiring good data. Unlike other applications, however, it is possible to correct for uneven illumination using software. Applied Precision uses a proprietary algorithm for doing panel flattening. This proves important because it is extremely difficult to illuminate each of these panels precisely even from end to end, and fluorescence measurements are sensitive to illumination variations.
System calibration for a given fluorophore makes use of a target slide, which contains equal fluorescence properties across its surface. The test procedure starts with imaging this slide while it is moving so that none of the specific features of the slide get embedded in the calibration file. Since the slide is in motion, small-scale variations in fluorescence (granulation) on the calibration slide smear out of the acquired image.
Calibration exposures are performed 12 times using different time exposures to produce a linear regression fit against exposure time for every pixel. This accounts for illumination variations, CCD sensitivity variations, and spatial variations introduced by other elements in the light path. Therefore, when the researcher selects a particular exposure time for imaging a panel, the system contains all the necessary information to flat-field-correct panel images at the specified wavelength and exposure time.
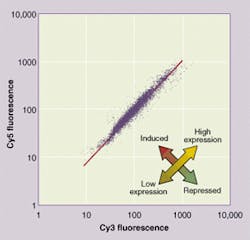
FIGURE 4. Gene-expression curve is a scatter plot showing the ratio of expression in experimental versus control tissues for each gene tested (top). Genes from experimental tissues are tagged with a red fluorescing dye (Cy5). Normal genes are tagged with Cy3 dye, which fluoresces in green (bottom). Genes unaffected by the experiment appear clustered around the diagonal line with unity slope. Experimentally promoted genes appear as outliers above the slope line. Experimentally repressed genes appear below the line. Analysis software helps researchers set criteria for separating interesting from uninteresting genes and identifying them from their positions on the microarray.
The arrayWoRx scanner includes all the analysis software needed to do a complete validation of a microarray experiment. A key difficulty for most researchers is keeping track of what is printed on the slide. This may seem surprising until the complicated process involved in producing a microarray and the amount of bookkeeping needed are considered.
Microarrays are prepared from standard 4 x 6-in. laboratory microtiter plates having either 96 or 384 tiny sample wells that are used to purify, isolate, and store cDNA samples. A robotic printing system using a number of fine-tipped pens prints the microarray. The robot dips the pens into the wells of the microtiter plate to pick up a drop of the sample and then dabs it onto the microarray slide in a predetermined spot.
The pattern that the robot uses to print microarrays is variable. It depends on the type of robotic printer being used, and many different combinations of patterns are possible. Determining what cDNA variant is printed in what spot can be a major problem. The arrayWorRx software allows the researcher to describe the contents of the microtiter plate, and then the pattern of how the robot picks up those contents and transfers them to the microarray.
Bottom line
The information that researchers prefer, however, is best seen in a gene-expression curve. A gene-expression curve is a scatter plot of the red-fluorescence intensity versus green-fluorescence intensity for each spot (see Fig. 4). Data points that represent spot-binding genes, whose expression level is the same in the experimental tissue as in the normal tissue, cluster along a line that has a slope of one. Spots where the gene expression differs between experimental and normal tissues appear above or below that line.
The arrayWoRx analysis software lets the researcher set a specific confidence interval for the statistical evaluation of the spot population. When the interval is set at, say 80%, the software will differentiate data points within the 80th percentile group and those farther away—either above or below the slope. The analysis software also includes process-control features derived from Applied Precision's semiconductor-processing experience. These features use measurements of coregistration and coefficients of variation of pixels within spots to provide clues to whether the slide will provide good data or if the researcher needs to go back and improve the preparation steps.
Being able to monitor thousands of gene products simultaneously in a single experiment on a single slide gives biotechnology researchers an enormously flexible and powerful imaging tool for experiments involving genes and genetic expressions. Looking at normal baseline levels of gene expressions and being able to detect-in handfuls of genes out of thousands and thousands-which genes change between normal and diseased states is key to understanding biological processes.
Company InformationAmersham Pharmacia BiotechPiscataway, NJ 08855Web: www.apbiotech.comApplied Precision
Issaquah, WA 98027
Web: www.appliedprecision.com
Silicon Graphics Computer Systems
Mountain View, CA 94043
Web: www.sgi.com


