Using MRI data and image processing to speed patient diagnosis
Using MRI data and image processing to speed patient diagnosis
By Andrew J. Worth
With the advent of powerful image-processing workstations and medical image-processing tools, it is now possible to study the human brain in greater detail than ever before. Currently available image-processing software allows magnetic-resonance-imaging (MRI) data to be rapidly transformed into three-dimensional (3-D) data representations using Fourier techniques and to be resliced and viewed in coronal, sagittal, and axial viewing planes or arbitrary slice orientations.
Such software can also perform arbitrary zooming, display multiple slices of images in a window, and facilitate the drawing of regions of interest for further analysis. Better still, by complementing these software-development tools with sophisticated registration, segmentation, and functional MRI algorithms, researchers are expanding the horizons of MRI-based image processing.
Registration and segmentation
To allow multiple images of the same subject to be compared and to enable the fusion of multiple types of data, registration algorithms must first bring different images into positional alignment. This technique has been used, for example, by Peter Freeborough and Nick Fox at the National Hospital for Neurology and Neurosurgery (London, England) to measure the change in brain volumes of patients with Alzheimer`s disease. Although in the past image registration was accomplished manually, it can now be done automatically with algorithms such as Automated Image Registration (AIR) developed by Roger Woods at the University of California--Los Angeles.
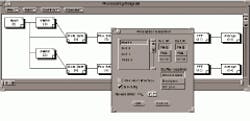
Registration can also overlay positron-emission-tomography (PET) images or functional MRI (fMRI) images onto structural MRI images of the subject or onto an atlas (see Fig. 1). This allows the measurements of brain function to be localized; the parts of the brain that light up in the PET or fMRI image can be identified. Furthermore, registration of the brain scans of different subjects allows comparisons between and among different populations.
Because demanding research and clinical applications require extraction and subdivision of specific central nuclei and external gray-matter regions, segmentation techniques are used to divide MRI images into regions of gray matter (neuron cell bodies), white matter (connections between neurons), and cerebral spinal fluid. This is useful, for example, in measuring the volume of the hippocampus (a brain structure associated with memory) in patients with Alzheimer`s disease to evaluate drug responses.
Ron Kikinis and his colleagues at Brigham and Women`s Hospital Surgical Planning Laboratory (Boston, MA) have used semiautomated MRI segmentation and registration of data with live video of the patient. This involves using a laser-striping device with an accuracy of less than 1 mm and a surgical probe that allows the surgeon to point to various places or structures in the brain (see Fig. 2).
Similarly, tumor, stroke, or multiple-sclerosis lesions can also be measured. In neuroscience research, segmenting the brain has allowed significant differences to be found in the volumes of brain structures of schizophrenic patients. Segmentation highlights locations affected by or that have an effect on the disease and narrows the researcher`s focus in finding the cause of the disease.
Precise and completely automatic segmentation of the entire brain is not yet possible, and researchers must perform this manually, but it can be sufficient to use statistical classification methods such as k-means, fuzzy c-means, iterated conditional means, or backpropagation neural networks to get a reasonable result. By devising an adaptive segmentation method, Sandy Wells and his colleagues at Brigham and Womens Hospital and the Massachusetts Institute of Technology (Cambridge, MA) have automatically measured lesions of the brain in thousands of patients with multiple sclerosis.
Another new technique for image segmentation involves warping a brain atlas to align it with data from MRI scans. Because the atlas has been previously segmented manually, desired regions can be easily located on the subject`s brain. Gary Christensen of Washington University (St. Louis, MO) described this deformable textbook technique in his 1994 doctoral dissertation.
Processing functional MRI
Functional MRI is a technique that can measure changes in blood properties as they relate to brain activity. By subtracting images obtained during a stimulus event from images obtained without the stimulus, the activity of specific brain regions can be highlighted. This provides additional clues to the workings of neural computational mechanisms and can lead to treatments for visual deficits.
At the Boston University Center for Adaptive Systems, Frank Guenther and his colleagues have used fMRI to measure the difference in brain activation between prototypical vowel sounds and nonprototypical vowel sounds. Patients listened to a tape of these vowel sounds while images were acquired of regions of their brain related to hearing. The images that correspond to a particular sound are then averaged over multiple repetitions and a statistical analysis (a P test) is performed to detect changes in the images. If these changes are greater than a predefined threshold of statistical significance, their levels are mapped to a false-color scale and are overlaid onto a structural magnetic-resonance image for display (see Fig. 3, right).
Functional MRI has also proven valuable in the surgical treatment of brain lesions by allowing regions with essential brain functions to be located. The surgeon can avoid damaging these regions while removing as much diseased or dysfunctional tissue as possible. Other researchers have used fMRI to measure the brain`s response to cocaine (see Fig. 4).
Diffusion tensor MRI
While the contrast mechanism that makes fMRI useful relies on changes related to perfusion (that is, blood flow in the brain), another type of imaging, diffusion-weighted tensor MRI (DT MRI) exploits the properties of diffusion in the brain. Because water molecules diffuse more easily in the direction of nerve bundles rather than perpendicular to them, DT MRI scans can visualize the location and direction of white-matter fiber tracts in the living human brain and allow connectivity of the brain to be studied. This is useful in assessing spinal-cord and traumatic brain injury and locating white-matter bundles that must be avoided during surgery. At the Center for Morphometric Analysis at Massachusetts General Hospital (Boston, MA), Nikos Makris has demonstrated that DT MRI can display white-matter tracts and that the tracts are affected by a stroke lesion (see Fig. 5).
Image-processing packages that handle only 2-D images are not as useful as the programs specifically designed for 3-D imaging that include image-reconstruction algorithms. And although more-sophisticated algorithms for registration, segmentation, and functional algorithms are only available as source code from research institutes or universities, the most commonly available medical-software packages allow various levels of image processing and manipulation of 3-D MR brain images (see pp. 45 and 46). In the future, however, as such techniques are more commonly used in practical and research applications, it is likely that manufacturers will augment their code accordingly.
ANDREW J. WORTH, Ph.D., is at the Center for Morphometric Analysis, Massachusetts General Hospital, Charlestown, MA 02129; e-mail: [email protected].
Medical imaging on the Web
Medical Imaging FAQ
ftp://rtfm.mit.edu/pub/usenet-by-group/news.answers/ medical-image-faq/volume-visualization
Medical Imaging on Yahoo
www.yahoo.com/Health/Medicine/Medical_Imaging/ Magnetic_Resonance/
The Basics of MRI by Joseph P. Hornak, Ph.D.
www.cis.rit.edu/htbooks/mri/
Human Brain Project
WWW-HBP.scripps.edu/
Software for magnetic resonance image processing and visualization
AIR (Automated Image Registration) bishopw.loni.ucla.edu/AIR3/index.html
VIDA--Volumetric Image Display and Analysis, University of Iowa
everest.radiology.uiowa.edu/vida/ vidahome.html
iMIPS
www.imips.com/
MEDx--Sensor Systems Inc.
www.sensor.com/
3DVIEWNIX
mipgsun.mipg.upenn.edu:80/~Vnews/
ANALYZE from CNSoftware
www.cnsoft.com/Info/Analyze.html
Mvox
serv1.imm.dtu.dk/~mvox/
THERAVIEW from 3D Biomedical Imaging
www1.hp.com/solcat/company/ 38821.html#P1
Radiation Oncologist Workstation from Computerized Medical Systems
www.cms-stl.com/
VoxBlast from VayTek
www.vaytek.com/VoxBlast.html
Alice from Parexel (Hayden Image Processing Group)
www.perceptive.com/ALICE.HTM
Amedic-3D from A1 Alpha Space
www.a1-alpha-space.com/
ImageVolumes from Minnesota Datametrics
gopher://gopher.mndata.com:2074/1
IBM Visualization Data Explorer (DX)
www.almaden.ibm.com/dx/
AVS from Advanced Visual Systems
www.avs.com/
Image-Pro Plus
www.mediacy.com/ippage.htm
Brain Image from Johns Hopkins (Mike Abrams)
sol.med.jhu.edu/manual/brain_image_ manual.html
OSIRIS from the University Hospital of Geneva
www.expasy.ch/www/UIN/html1/ projects/osiris/osiris.html
V from the University of Illinois at Urbana-Champaign
v.brl.uiuc.edu/
MeVis from the Center for Medical Diagnostic Systems and Visualization, University of Bremen, Germany
www.cevis.uni-bremen.de/ilab/index.html
UTHSCSA ImageTool
ddsdx.uthscsa.edu/dig/itdesc.html
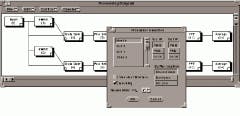
FIGURE 1. Roger Woods at UCLA developed Automated Image Registration, a statistical technique that can overlay statistical data from fMRI measurements onto structural data. The technique is incorporated into the MEDX package from Sensor Systems (Sterling, VA).
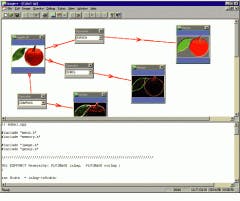
FIGURE 2. By combining MRI data with surgical tracking probes, surgeons are better able to locate areas of the brain during operations. Here, a surgical probe has also been tracked using the Flashpoint 3-D tracking system from IGT (Boulder, CO) that allows the surgeon to point to various places or structures in the brain and see the position in the 3-D model. (Image courtesy the Surgical Planning Laboratory at Brigham and Women`s Hospital).
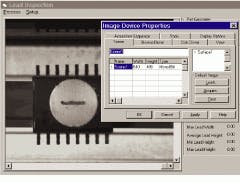
FIGURE 3. By using fMRI, the perceptual magnet effect in the perception of vowel sounds can be measured. From these data, it can be seen that sounds that are vowels are perceived differently than nonvowel sounds that are close to real vowel sounds. (Image courtesy Andrew Worth, Center for Morphometric Analysis, Massachusetts General Hospital)
FIGURE 4. MRI image analysis has been used by Hans Brieter and his colleagues to study the effects of cocaine use on the brain. A cross section of brain tissue (left) and an MRI image (right) illustrate the amount of change in brain activation encoded in colors ranging from blue (low use) through red to yellow (high use). (Image courtesy Hans Breiter)
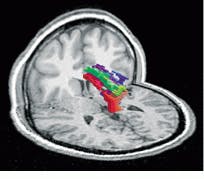
FIGURE 5. Using DT MRI techniques, physicians can visualize the white-matter fiber tracts in the brain. This image has been color-coded to show the direction of the tracts. Green represents fibers that run from front to back in the subject`s head, red shows fibers that are directed side to side, and blue indicates that the fibers run top to bottom. Intermediate directions have intermediate colors. (Image courtesy Andrew Worth, Center for Morphometric Analysis, Massachusetts General Hospital)