Using PC-based to study molecular structure
Using PC-based to study molecular structure
By Andrew Wilson, Editor at Large
1807, Ferdinand Reuss observed the migration of colloidal particles in an electric field. Recorded as the first observation of electrophoresis, the technique is now used to separate and characterize proteins, acids, nucleic acids, and viruses according to their charge and weight. While early methods of electrophoresis on paper, cellulose acetate, and starch gels have disappeared, they have been replaced by methods that use agracose or polyacrylamide gels. The presence of such
gels provides both a support medium and a sieving effect, so that particles can be characterized by both charge and size.
"As a generalization," says professor Anthony T. Andrews of the School of Food and Consumer Science at the University of Wales Institute (Cardiff, Wales), "polyacrylamide gels are best for smaller molecules such as proteins, nucleic acids, and fragments, while agarose gels extend to large proteins, lipoproteins, intact DNA, RNA, and viruses."
Multiple gels
Polyacrylamide gel electrophoresis (PAGE) is often performed using a single-gel concentration. In such experiments, the migration distances of particles are compared with known standards and the molecular sizes of the samples then determined. However, for many proteins, molecular shapes can be similar and thus difficult to discriminate using a single-gel method. To compensate for this, the mobility of such molecules can be measured in a number of gels of differing polymer concentration and pore size. When mobility is then plotted against gel concentration in a plot known as a Ferguson plot and compared with known standards, protein molecular weights can be accurately determined.
"A commonly used variant of PAGE, known as SDS-PAGE, uses the detergent sodium dodecyl sulfate (SDS) to break up molecules into their polypeptide chain subunits," says Andrews, "as such PAGE and SDS-PAGE complement one another to provide a powerful approach to the study of molecular structures."
To produce separations that are charge-based, a process known as isoelectric focusing is used. In this procedure, proteins migrate through a pH gradient until they reach an isoelectric point where the molecule has no net charge and movement ceases.
In 1975, researchers combined both charge and weight separation in a process known as two-dimensional (2-D) electrophoresis. By performing charge-based separation with size separation in the second dimension, a 2-D electrophoresis plot is produced.
To perform 2-D electrophoresis, researchers often use third-party laboratories such as Kendrick Laboratories (Madison, WI). Here, proteins are first broken down to denatured polypeptide subunits by dissolving them in an SDS buffer and then applied to the top of a 2.5-mm-thick tube containing 2% ampholines. After isoelectric focusing (IEF) is performed, the tube is sealed to the top of a stacking gel overlaying a 12 ¥ 15 ¥ 0.75-mm slab and slab gel electrophoresis is performed. In this way, the polypeptides are separated independently by their isoelectric point and molecular weight. According to Kendrick Labs, as many as 1000 polypeptide spots can be resolved on a single 2-D gel as opposed to the 50-band maximum obtained by either dimension alone.
"With the level of complexity seen in 2-D patterns," says Andrews, "automatic scanning and computerized data acquisition and handling are obligatory." Luckily, a number of companies are stepping in to meet this de mand with a range of scanners, image-processing hardware, software, and complete analysis systems. But digitizing such gels is not an easy task.
Image calibration
For accurate image analysis, calibration of the image-capture device is essential, especially if the device is operating outside its linear response region. "For critical work, a neutral density filter must be acquired at the same time as the experimental image to confirm the response curve of the image-capture device," says Bruce Venning of Phoretix International (Newcastle upon Tyne, England), a manufacturer of one-dimensional (1-D) and 2-D analysis and documentation software. However, while intensity calibration is important, it can be unnecessary if staining methods are not linear. In such cases, results can be calculated from a standard curve created from the measured values of standard bands or spots with their known values.
To account for the differences between lanes and along the length of each lane, background subtraction can be used. While background profiles can be obtained easily in 1-D electrophoresis, the preferred methods in 2-D electrophoresis relate to the intensity values around each spot.
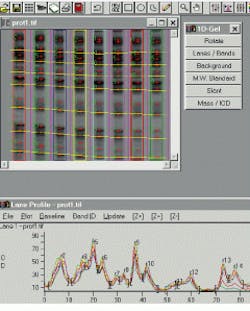
In 1-D gels, band boundaries are detected by computer analysis of the lane profile. Running under Windows 95/NT, the Gel-Pro Analyzer from Media Cybernetics (Silver Spring, MD) is typical of third-party software packages for 1-D electrophoresis. In Version 3 of the package, released last year, the company added enhanced support for images with high resolution and high dynamic range, automatic lane finding with adjustment parameters, multiple standard lanes and automatic slant detection, and a built-in saturation warning for overexposed images (see Fig. 1).
Like the Gel-Pro Analyzer, GelCompar from Applied Maths (Kortrijk, Belgium) also uses automatic lane-finding algorithms to correctly locate even distorted patterns on all kinds of gels. Tracking splines may be displaced or deformed manually to avoid spots or distorted areas, using a variable number of nodes. As well, the integration area of the tracking splines may be widened to cover the whole band for densitometry quantification or narrowed to avoid peak spreading (see Fig. 2).
For the proper alignment of gels, GelCompar consistently normalizes gels by the alignment of bands on dedicated reference profiles according to a set of reference-band positions, defined by the user on the database standard profile. A pattern-recognition algorithm allows automated normalization of the gel and ensures the best alignments mathematically possible between reference patterns. In addition, internal reference bands present in all patterns or just some patterns can be applied to provide a supplementary correction or an alternative normalization.
Two-dimensional electrophoresis
Unlike 1-D software packages, 2-D electrophoresis packages analyze digitized gel images by identifying and outlining individual protein spots, measuring molecular weights, isoelectric points, and densities for each spot detected. In Gellab II+ from Scanalytics (Fairfax, VA), for example, gel images can be aligned and matched to find paired spots. Based on the theoretical approach of the Gellab-II system developed at the National Cancer Institute by Peter Lemkin of the Image Processing Section, Laboratory of Experimental and Computational Biology, National Cancer Institute, National Institutes of Health (Frederick, MD), Gellab-II+ is the result of a technology-transfer agreement between NCI and Scanalytics.
In operation, Gellab II+ maximizes the alignment between gels by overlaying regions of the reference gel onto the sample gel to determine matching areas, defining landmarks as anchor points for aligning and pairing the sample gels with the reference image, and finding the spots that match. Comparative data for each spot include molecular weight, isoelectric point, concentration, area, integrated optical density, pixel location, pair identifier, raw density, and mean density. Using the database query functions in the Gellab II+ system, users can screen the data and establish definitive relationships between spot pairs and matched gels in a large multigel study. In addition, composite gel images can be assembled from several processed gel images providing comparison for presentation and report generation.
Pro-Quanta from DNA ProScan (Nashville, TN) also can be used to analyze and compare the intensity of the bands or spots on gel images. Used with 1-D and 2-D gels, images are calibrated based on the known quantities associated with particular spots or bands. The software then computes a standard curve and reports the relative quantities associated with other unknown spots or bands. Background subtraction allows local background intensity effects to be compensated for and data can be reported in absolute amount units or in calibrated, relative-intensity units.
Database retrieval and analysis
For scientists involved with electrophoresis, image analysis is only one part of the problem. Another more important aspect of electrophoresis is comparing samples from different laboratories. To do this, manufacturers such as Phoretix are making available software that combines analysis and database functions. Known as Database, the Phoretix package, for example, allows an unlimited number of experiments and analyses to be stored. As well as providing a gel-display window with a full range of image-processing procedures, the package also allows queries to be made in a batch mode.
In the case of two-dimensional protein electrophoretic gel images, maps identifying proteins in these gels are becoming increasingly available on the Internet. With this in mind, Peter Lemkin has developed Flicker, a method for comparing images from different Internet sources. Visually comparing two-dimensional sample gels against these two-dimensional gel database maps may ease protein-spot identification in many cases (see Fig. 3).
As a Java applet, the Flicker Image Viewer can read two images from the Internet and then display them in a Web browser. Images can be enhanced in various ways and compared visually in a third window called the Flicker window. Before comparison, images may first be enhanced by spatial warping, pseudo 3-D projections, image sharpening, contrast enhancement, and other transforms. Transformed images may then be presented using flickering.
While image and database analysis tools combine to ease the task of molecular analysis in two-dimensional electrophoresis, future image-processing packages may also incorporate image-understanding algorithms to visually compare samples. In this way, much of the tedium of electrophroretic analysis will be eliminated. At the same time, the development of a reusable electrophoreis matrix may eliminate gel preparation and staining. "The elimination of all consumables will lead to shorter overall experiment times and higher sample throughputs," concludes Andrews.
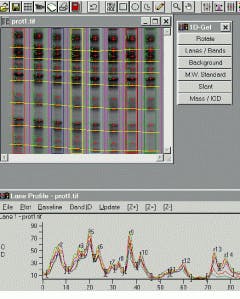
FIGURE 1. Gel-Pro Analyzer from Media Cyberbernetics provides automatic identification of lanes and bands in an electrophoresis image and allows output results to be imported into Microsoft Excel spreadsheets for further analysis.
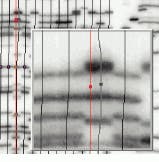
FIGURE 2. GelCompar from Applied Maths allows the user to displace tracking splines so that spots or distorted areas within the image can be avoided.
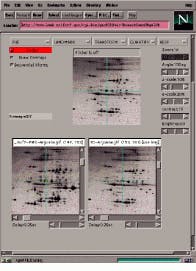
FIGURE 3. Running in Netscape Navigator, Flicker allows 2-D electrophoresis images to be compared over the Internet.