Hyperspectral imaging system grades agricultural products
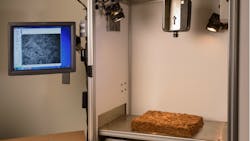
Traditionally, tobacco used in US blended cigarettes must be manually inspected based on visual, physical, and sensory characteristics, a process subject to human error and associated labor costs. To reduce subjectivity and streamline the grading process, scientists at Altria (Richmond, VA, USA; www.altria.com) developed a hyperspectral imaging system at its stemmery processing facility to verify different blend grades of tobacco (Figure 1).
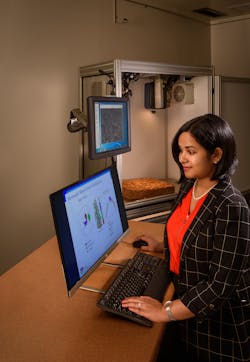
Harvested and cured tobacco plants used typically consist of three main types of tobacco: flue-cured, burley, and oriental. Based on external factors such as growing location, weather, leaf position on the plant, color, and texture, the plants are further divided into grades, a process previously done by manual inspection. Altria developed the new leaf blend grade verification hyperspectral imaging system to streamline the tobacco grading process. Amrita Sahu, Senior Scientist at Altria and colleague Henry Dante were awarded the Jack Nelson Innovator of the Year Award in 2016 for their work (Figure 2).
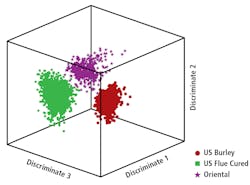
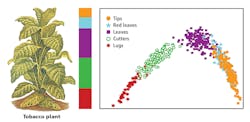
“This system has been able to differentiate between the three major groups of tobacco, US Burley, Flue-Cured and Oriental” says Sahu. “The system can also differentiate between stalk positions of the same plant,” says Sahu.
Used for image capture within the system’s enclosure, an SOC710 visible near-infrared (VNIR) hyperspectral camera from Surface Optics (San Diego, CA, USA; www.surfaceoptics.com), connects to a ThinkCentre M93p PC and monitor combination from Lenovo (Beijing, China; www.lenovo.com). The push-broom, line-scan camera offers a spectral range of 400 to 1000 nm, spatial resolution of 4.69 nm, and 128 spectral channels.
Two fixed 120V/250 W tungsten halogen light bulb fixtures placed at the top of the enclosure above the camera provide illumination, while a cooling fan regulates temperature and two fans installed on each side of the assembly maintain a level of negative pressure, ensuring that dust does not settle on the camera lens. Additionally, a metal shroud surrounds the camera containing an opening large enough for the lens to fit through while also allowing access to the rear of the camera for cable management and removal. The shroud also prevents the sensor from overheating, reducing potential image noise.
Custom software written in the interface data language (IDL) programming language from L3Harris Geospatial (Boulder, CO, USA; www.harrisgeospatial.com) gathers images collected by the camera. Version 4.5 of L3Harris Geospatial’s software and the IDL programming language performs image analysis.
Over the course of three years of tobacco seasons, the team at Altria collected data used for training the blend grade verification algorithm. The system images a Spectralon standard white reference from Labsphere (North Sutton, NH, USA; www.labsphere.com) and records the dark current prior to imaging the sample. An operator then places tobacco samples in the enclosure for imaging at spatial sizes of 520 x 696. Preprocessing consists of a scan of the entire image pixel-by-pixel to remove saturations and shadows. Saturated pixels are determined by checking whether each pixel’s maximum value equals 4096— the largest value possible with a 12-bit sensor. The threshold for shadow pixels is 500, a value determined by statistical analysis of known shadow pixels.
After removing dark noise, the software applies a median filter to remove any kind of instrument artifacts present in particular bands. Images are then spatially reduced by taking the average of all spectra in a 3 x 3-pixel block and reassigning those spectra to a new image one-ninth the size of the original, which is done to reduce computational load and noise during feature extraction. Each pixel is multiplied by a correction ratio:
where CR is the correction ratio vector and h and w represent height and width.
The arithmetic average of each pixel vector is calculated and subsequently divided by the standard reference vector (SR), which is an average of the white reference taken at the beginning of the process. Lastly, the method of unit vector normalization applies to reduce each spectrum to a length of one.
Using the image analysis software, the system displays whether the sample corresponds to its labeled grade, an adjacent grade, or two or more grades away (Figure 3). The latter case results in an anomalous classification for the sample. The system only images the white reference at the initial startup of the program and again every thirty minutes within a session.
Due to the high dimensionality of hyperspectral imaging data, spectral feature extraction is required. The team designed the blend grade verification algorithm to classify an image of tobacco based on a distance metric to a previously calculated reduced spectral signature of each type and grade, which required building a library of the unique spectral features of each tobacco grade. The sequential maximum angle convex cone endmember model (SMACC; bit.ly/VSD-SMACC) was used as the endmember extraction procedure.
Depending on the type of tobacco, five or six endmembers were extracted to represent the spectral characteristics of each type and grade of tobacco. Using linear spectral unmixing, abundance values were calculated for each type and grade combination and used as the defining parameters (spectral profiles) for classification. Each tobacco season, the first six samples of every tobacco grade are used to calibrate the initial values of the model to account for annual crop variations.
Once images are preprocessed, data is linearly unmixed using the predefined endmembers. The endmember abundance values are calculated for each pixel and the average of these abundances are obtained for the entire image. A five-feature vector is obtained, representing the spectral profile.
Mahalanobis distance (bit.ly/VSDMAHA) is calculated between the spectral profile of the image to be analyzed and the spectral profile found during feature extraction. If the sample is within three standard deviation of the labeled class centroid, then it is acceptable. If the sample is outside of three standard deviation of the labeled class centroid, the class distance is calculated by:
where the CDR represents class distance ratio, LCD the labeled class distance, and MACD the minimum adjacent class distance. If the class distance ratio is less than 70%, the sample is inspected. If the class distance ratio is greater than 70%, the sample is acceptable.
Spectral profiles of all three tobacco groups are reduced to three features using linear discriminant analysis (LDA) for clustering and visualization. The 3D LDA cluster plot shows clear separation between the three major tobacco groups. The spectral profiles of the different stalk positions of a tobacco plant (tips, red leaves, leaves, cutters, and lugs) were reduced to two features using LDA and plotted. The 2D LDA plot of spectral data of tobacco plant stalk positions showed clear difference between them. Overlap between the tips and red leaves exists, which is expected,since the chemical and sensorial characteristics are similar (Figure 4).
The results of the tobacco blend grade verification algorithm were verified against the human grade. The relative accuracy of the method for flue cured and burley tobacco grade reached 93%, a number obtained by taking the number of samples correctly classified and dividing the total number of samples imaged for the entire crop year.
Issues such as blown light bulbs and unfocused lenses resulted in misclassified samples. To address this, Sahu introduced a master sample feature. If anomalies arise, the operator enters a master sample representative of the original labeled grade and checks if the system is properly working. If the system confirms the master sample belongs to the same grade, the operator sets it aside for further inspection by a trained human grader. If the system does not confirm the master sample, the software closes and blocks the operator from further use until the cause of the issue can be determined. After the team implemented the system, sample images are captured every hour and an electronic report becomes available in case corrective actions are required.
“The system resulted in a streamlined inspection process where tobacco can be shipped right away, reducing storage costs at the facility and backlog in shipping,” says Sahu.
Although developed for tobacco, the system can also be used for grading agricultural products like tea, coffee, or grapes, suggests Sahu.
About the Author

James Carroll
Former VSD Editor James Carroll joined the team 2013. Carroll covered machine vision and imaging from numerous angles, including application stories, industry news, market updates, and new products. In addition to writing and editing articles, Carroll managed the Innovators Awards program and webcasts.


