X-ray fluorescence scanner assists painting restoration
Authentically and safely restoring centuries-old paintings that may feature yellowing paint colors or small amounts of damage requires a comprehensive understanding of the chemical composition of the colors used by the artist, which may have been custom mixed, making accurate replication of the paint colors a challenge.
For example, the element copper sometimes appears in white paint. This suggests the presence of azurite, a copper-based blue. Copper detected in a sample of white paint therefore suggests to a restorer that the white paint also includes some amount of blue paint. Without this chemical analysis, pure white paint applied during restoration would make the restored painting less accurate compared to its original appearance.
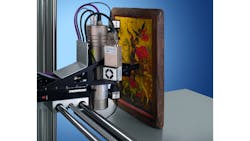
Engineers at Bruker Nano GmbH (Berlin, Germany; www.bruker.com) developed an X-ray fluorescence scanner, the M6 JETSTREAM, to tackle this and similar challenges, allowing objects to be simultaneously imaged by RGB cameras and an X-ray spectrometer. This allows the creation of overlapped images for use in chemical analysis that can isolate and display selected elements.
The scanner incorporates a spectrometer with X-ray tube and focusing lens that generates fluorescence, which measures the chemical composition of individual spots as small as 100 µm at speeds up to 100 mm/s. The optical image is captured with two UI-2230SE-C-HQ-model USB2 uEye SE cameras with 1024 x 768 resolution from IDS Imaging Development Systems (Obersulm, Germany; www.ids-imaging.com). Bruker Nano chose USB2 because it better facilitates the use of multiple cameras as opposed to the alternative GigE interface.
The first camera has a ~10 x 10 cm2 field of view (FOV) and creates overview images of each sample, or the object being scanned by stitching together multiple still images from a grid of positions. Since the measurement spot of the spectrometer is only 100 µm, the application doesn’t use an individual RGB image for each measured spot. Instead, the spectral data is overlaid on the pixels of the camera image to create the data cube.
The second camera has a FOV of 1 x 1 cm2 and focuses the spectrometer on each sample surface for precise positioning of the measurement spot on small features like a single brushstroke or a surface impurity.
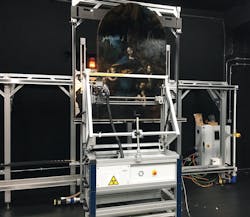
The scanner’s kinematics system consists of two axes (X and Y) mounted on a gantry that can tilt to allow measurements of samples standing upright or samples lying down. The X and Y axes allow a full travel of 800 x 620 mm2 and area of 800 x 600 mm2 that can be measured in a single run at a maximum movement speed of 100 mm/s. The measurement head mounted on the axes moves via a motorized Z-axis with maximum travel of 90 mm.
After positioning the painting in front of the spectrometer, the image of the high-magnification camera, with a fixed focus, helps align the spectrometer the correct distance from the painting. The low-magnification camera scans the entire area of interest image by image and custom software developed by Bruker Nano GmbH creates a stitched overview image.
Because the scanning is done by high-precision mechanics, and the low-magnification camera’s optics determine the field of view, each pixel of the overview image can be linked to a position in the spectrometer’s coordinate system. This means a user can move either the center of the high-magnification camera image for close inspection of small features, or the focused X-ray spot for spectrometry, to any position simply by clicking on the overview image in the system’s user interface.
Related: Image fusion techniques reveal hidden information
The X-ray fluorescence spectrum data and camera image for each measuring point overlap to create what Bruker Nano calls a HyperMap, an image of the sample that painting restorers filter to display only specific elements and highlight where they are present in the sample. Bruker Nano’s software that creates the HyperMap runs on Windows operating systems and supports any x64 processor and OpenGL-compatible GPU. The images integrate via an IDS software development kit.
For instance, in a recent deployment of the scanner at the National Gallery in London (Trafalgar Square, London, UK; www.nationalgallery.org) as part of a restoration effort for the Leonardo da Vinci painting Virgin of the Rocks, art historians were given a detailed look at an under-drawing, whose existence was previously known. The under-drawing was produced with a pigment that contained zinc. When the zinc map was selected on the HyperMap, the under-drawing became more visible than previously possible.
Selecting specific elements also allows art historians to analyze the position of individual pigments within the painting. This can reveal pentimentos, changes and additions made to the picture over time. Differences in pigment consumption on different layers of the painting may suggest that different artists worked on the same painting, for example.
The M6 JETSTREAM X-ray fluorescence scanner can also be used for horizontal samples such as drill core analysis, to examine geo-history, rock and sediment sequences, and paleo-climatological development.
About the Author

Dennis Scimeca
Dennis Scimeca is a veteran technology journalist with expertise in interactive entertainment and virtual reality. At Vision Systems Design, Dennis covered machine vision and image processing with an eye toward leading-edge technologies and practical applications for making a better world. Currently, he is the senior editor for technology at IndustryWeek, a partner publication to Vision Systems Design.

