Four ways to improve lens performance while minimizing cost
Cory Boone and Nick Sischka
Machine vision components have become vastly more complicated in the last decade. For example, the number of available image sensors and the variety of optics that must match with them to work have skyrocketed. To ensure success, developers must stay on top of such updates to have confidence in their choices when building a new system.
Take maximizing the performance of optics, for instance. Simply looking at datasheets and performing first order calculations rarely proves sufficient in determining if a lens can perform a given task. Luckily, even without being an optics expert, some best practices that consistently help maximize performance exist. The following article discusses these tricks and explains proper use. Irrespective of both the lens manufacturer or type of lens, these best practices prove useful, and keeping them in mind will always help get the most out of a lens for the money spent on it.
Working distance to field of view ratio
First and arguably most important, make sure the working distance to field of view (FOV) ratio for a lens/camera system sits between 2:1 and 4:1. Available space represents one of the most important lens performance drivers. The less space between the object and the lens, the more the lens will cost and the worse it will perform. While minimizing the space an optical system takes up may initially seem more efficient, the resulting cost and performance degradation may not be worth it.
Related: When to integrate liquid lenses into machine vision optics
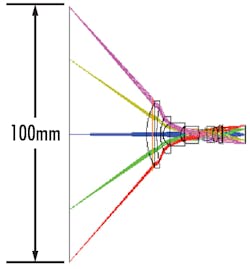
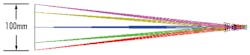
Figure 1 shows two different lenses with the same FOV. The top lens has a 3.5 mm focal length while the bottom lens has a 35 mm focal length. The immediate thing that stands out is that the left lens is much closer to the object than the right lens to achieve the same FOV— a direct result of the focal length of the lens.
Perhaps a less obvious takeaway, the rays bend much more strongly through the 4.5 mm lens than through the 35 mm focal length lens, resulting in much higher performance with the 35 mm lens. Sharper ray bending typically corresponds with an increase in spherical aberration, which increases focused spot size and results in more blurry images. This practice also applies to the relationship between sensor size and focal length.
Choosing pixel size
Pixel sizes keep getting smaller and choosing the smallest pixel size may at first seem like the obvious path to maximizing performance. While smaller pixels increase the amount of points on the sensor that capture detail, performance may change once considering optics. In an ideal world free of aberrations and diffraction, resolution would solely depend on pixel and object size. However, the diffraction-limited resolution of a lens, the aberrations described by the lens’ modulation transfer function (MTF), and electrical noise all contribute to the final performance of the lens.
Diffraction, or the spreading out of light when passing through an aperture, occurs at every aperture in an optical system, reducing contrast. Aberrations are errors caused by manufacturing errors or physical limitations, and these also reduce contrast from ideal performance. As pixel size decreases, the frequency of pixels increases and contrast decreases. Because of this, increasing pixel size could provide better performance. Figure 2 shows an instance where increasing pixel size led to better system-level contrast.
Related: Telecentric imaging for machine vision: A practical implementation overview
Testing a lens and sensor together in a lab represents the most reliable way of determining compatibility, but the MTF curve of the lens is valuable when comparing options. When looking at the MTF curve of a lens to determine if it can resolve a certain spatial frequency, keep in mind that the minimum contrast should be at least 20%. At a contrast less than that, noise and other disturbances may prevent the system from achieving the proper resolution. Also, when reviewing MTF curves, be sure that the f/# and wavelength of the plot match that of the application. Not doing so may produce very different results. Aberrations typically limit the contrast of fast lenses (≤f/4), while diffraction limits slower lenses.

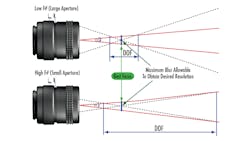
Matching f/# to depth of field
Lens f/# describes effective focal length to effective aperture diameter ratio. Smaller f/#s correspond with a larger internal aperture, resulting in greater light throughput. This also corresponds with better diffraction-limited performance. However, smaller f/#s also correspond with a shallower depth of field, or the ability of a lens to maintain a certain performance over a given working distance range (Figure 3). For situations where the objects being imaged have depth or when the placement of the objects may vary, larger f/#s may achieve more depth of field.
Adjusting f/# typically involves turning the iris adjusting ring. As pixel sizes get smaller, f/# becomes one of the most important limiting factors of a system’s performance because its effects on depth of field and resolution move in opposite directions. It may be necessary to decrease f/# to achieve a diffraction limited spot size suitable for small pixels, but this negatively impacts depth of field.
Color matters, go monochromatic
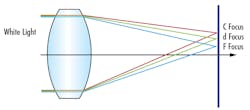
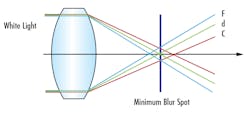
Using a monochromatic light source always improves the performance of an imaging system, even if the lens is designed for polychromatic use. The two primary types of chromatic aberrations experienced by machine vision lenses are lateral color shift and chromatic focal shift. Lateral chromatic aberration causes different wavelengths to focus to the same plane but at different heights perpendicular to the optical axis (Figure 4a). Chromatic focal shift, or longitudinal chromatic aberration, causes different wavelengths to focus at different points along the optical axis (Figure 4b).
Using monochromatic illumination improves contrast by eliminating both lateral color shift and chromatic focal shift. Achieving this proves simple by using LED sources, lasers, or filters. However, different wavelengths have different impacts on system resolution, as the diffraction limit is wavelength dependent (Table 1). Shorter wavelengths, such as blue or violet, result in the best diffraction-limited performance, and therefore the best system performance when aberrations do not dominate optical performance.
If specifying a machine vision system appears overwhelming, take a step back and consider these best practices. While they may not cover every consideration needed for your application, they cover the basic principles needed for achieving your desired performance while minimizing cost. Exceptions to every rule of thumb exist, but these tricks are effective in most situations. For additional guidance, discuss your application with component suppliers to ensure you get the proper cameras, optics, and illumination for your specific needs.
Cory Boone is Lead Technical Marketing Engineer and Nick Sischka is Manager of Imaging Sales Operations at Edmund Optics (Barrington, NJ, USA; www.edmundoptics.com).