Vision helps perform predictive maintenance
Vision enables engineers to perform predictive maintenance on assets in a plant quickly and accurately.
Chris Klosterman
Vibration analysis is a widely used predictive maintenance technique that enables engineers to evaluate the condition of equipment. In doing so, maintenance personnel can schedule repairs on the equipment during maintenance shutdowns to avoid failures during production runs.
One popular approach that has been deployed to visualize the vibration pattern of a machine involves the use of Operating Deflection Shape (ODS) analysis. In this process, vibration measurements are taken at a number of different locations on a machine using transducers. The data from the transducers is then analyzed by software to create a geometric stick figure model of the structure of the machine and display vibrational patterns.
However, the ODS analysis technique is not without its drawbacks. ODS requires a skilled person to configure mechanical transducers at specific locations on the machine before the data can be acquired. In many cases, the sheer number of collection points can prove problematic.
Having deployed such a system, engineers then need to set up a database to acquire the data from all the collection points and post process the data before a stick figure animation can be rendered. Although this can be achieved through software, it can take hours to complete such an analysis. Also, the data may then need to be further analyzed to determine what is happening physically between each of the points from where the data was acquired.
Vision vibrations
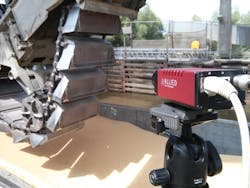
Now, however, engineers at Allied Reliability Group (Charleston, SC, USA;www.alliedreliability.com) have licensed patented technology developed by Dr. Jeff Hay at RDI Technologies (Knoxville, TN, USA; www.rdi-technologies.com) to create a vision-based system called OptiVibe that enables engineers to identify vibrational issues with their equipment with a greater degree of simplicity and in a much shorter period of time (Figure 1).

The OptiVibe system typically captures video images of an asset in a plant using Allied Vision Technologies' (Stadtroda, Germany;www.alliedvision.com) cameras, such as the Prosilica GE680. This camera uses a KAI-0340 CCD sensor from ON Semiconductor (Phoenix, AZ, USA; www.onsemi.com), which delivers VGA resolution at a frame rate of 205fps. Since the resolution and the frame rate of the camera determines the resolution of the displacement and the maximum frequency of the vibration that needs to be identified, cameras with higher resolution imagers and greater frame rates can be deployed if necessary. Typically, however, around 15 seconds of data are captured by the camera and transferred over a GigE interface to a PC where the images are stored prior to analysis.
Proprietary algorithms running in a National Instruments' (Austin, TX, USA;www.ni.com) LabVIEW application on a PC take the video input and process each pixel in the set of images to detect fluctuations in pixel intensity. By using a Fourier transformation, the time-dependent intensity data is then converted into frequency-dependent intensity data. The image processing software also generates Vibragrams, color-coded representations that appear as thermograms, but which show the movement of the asset, instead of its temperature, providing an intuitive means by which the vibration of the asset can be interpreted (Figure 2).
Having captured several seconds of video from a specific asset, the OptiVibe system can display the frequencies and their amplitude in those parts of the image where vibration is occurring. An engineer can then select a specific frequency of interest and study the Vibragram to determine which parts of the asset were vibrating at that frequency and the amplitude of the vibration.
Another option supported by the software enables a complete time waveform or an FFT of every pixel within the image to be displayed. By moving a cursor around the image of the asset, an operator can visualize all the frequencies and their amplitude at any point, rather than simply focus on frequencies of a specific wavelength. The result is the equivalent of placing an accelerometer on the equipment at different locations and viewing the different frequencies that are present.
Visualizing the calendar
To demonstrate the effectiveness of the system, engineers at Allied Reliability Group recently used the OptiVibe system to perform an analysis of a machine known as a calender. Widely used in the manufacture of paper, the calender comprises a series of heavy rollers driven by a series of motors through which the paper passes to ensure that it is smooth, glossy and of a uniform thickness.
The complexity of the calender and the many moving parts within it complicates the process of determining the cause and location of sources of any vibration. However, by using the OptiVibe system, it is possible to simultaneously collect vibration measurement data across entire video images to help localize vibrations and determine what sources are causing individual components to vibrate.
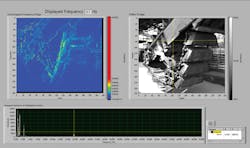
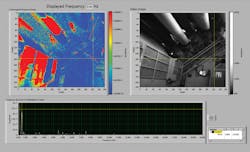
One benefit of the OptiVibe system is its ability to isolate vibrations spatially and relate them to one another across a scene. To demonstrate this capability, images were captured by the camera of the structure around one of the motors on the calender (Figure 3). A Vibragram created from an analysis of the images clearly shows two bright objects - the rotating shaft and a hand railing that are both vibrating at nearly the same frequency. From this, it can be deduced that it is most likely that the railing is being excited by the turning speed frequency of the rotating shaft.
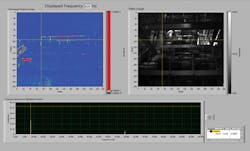
Images were also captured of the paper as it moved though the production process. On the calender, the paper moves through several rolls as it dries. The process uniformly dries the paper and keeps the density of the paper as uniform as possible. Contacting methods are impossible as the slightest pressure or disturbance on the paper can cause it to tear. Laser vibrometry would be possible but such systems are cost prohibitive and only measure one location at a time.
By capturing images of one of the paper rolls and analyzing those images with the OptiVibe software, the frequency at which the paper is vibrating on the roll can be visualized (Figure 4). The use of the OptiVibe software in such an application clearly opens up new opportunities for engineers to monitor such assets in many industries where material is produced on rolls.
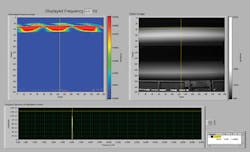
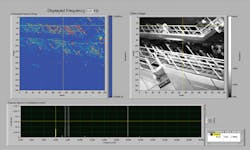
Video image data was also collected under the rolls of the calender. The goal was to demonstrate how the OptiVibe system could collect data on all parts of the machine simultaneously. Although the number of independently vibrating elements is enormous, the OptiVibe system can measure the vibration on all locations of the machine in a matter of minutes. Here, the belt vibration frequencies were measured, another complex task for contacting measurement methods. A belt vibration can be clearly seen, as the belt vibration is highlighted red in the Vibragram (Figure 5).
In another case, the system was deployed to show major structural vibrations in the machine. Here, it is apparent from the Vibragram produced from an analysis of the video data that a structural vibration is present as the entire structure is vibrating while other elements in the scene are not (Figure 6). With single point contact methods it would be difficult to separate local vibrations from global vibrations. But because this is feasible, engineers can determine which structural vibrations are present and the cause of those vibrations.
Useful images
The use of the vision-based system to perform condition monitoring offers opportunities for engineers to accurately measure the vibration of machinery, especially at locations in the machine that are moving where the use of traditional fixed transducers would prove impossible.
Since the system collects data simultaneously across all the aspects of a machine, engineers can also visualize how various components are interacting with one another, or to look at the complete asset. Hence, it is no longer necessary to choose which parts of a machine should be analyzed.
In addition, those aspects of the assets not specifically targeted during the collection process can be analyzed at a later date to enable patterns and correlations in the data to be visualized. The visualization process can also help engineers communicate where and how troublesome issues are occurring.
Through the use of a pair of synchronized cameras, the system can also be extended to enable engineers to visualize 3D images of an asset and its 3D vibrational modes. Rather than produce a traditional representative 3D stick model from an ODS analysis, engineers can now directly view images of the asset itself and its various modes of vibration.
Chris Klosterman, Vice President, Products and Technology, Allied Reliability Group, Charleston, SC, USA (www.alliedreliability.com)
Companies mentioned
Allied Reliability Group
Charleston, SC, USA
www.alliedreliability.com
Allied Vision Technologies
Stadtroda, Germany
www.alliedvision.com
National Instruments
Austin, TX, USA
www.ni.com
RDI Technologies
Knoxville, TN, USA
www.rdi-technologies.com