Fundamentals of machine vision lenses
Nicholas Sischka and John Lewis
View Image Gallery>>
With the decreasing size of pixels in today's high-performance cameras, the choice of correct lighting and optics is more critical than ever. Because of this continual reduction in pixel size, the achievable system resolution will often be limited by the lens and not the camera's sensor, making it more important to correctly select a lens early in a system development. By understanding fundamental lens parameters such as resolution and contrast, modulation transfer function, depth of field, and perspective; system developers will be better equipped to select the correct lens for their application.
Resolution and contrast
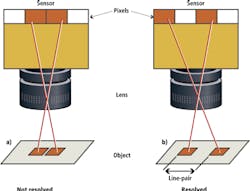
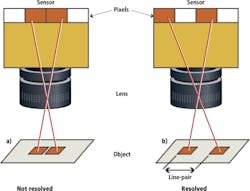
Resolution is the measurement of a vision system's ability to reproduce object detail. Figure 1(a) shows an image with two small objects with some finite distance between them. As they are imaged through the lens onto the sensor, they are so close together that they are imaged onto adjacent pixels. The resultant image will appear to be one object that is two pixels in size because the sensor cannot resolve the distance between the objects.
In Figure 1(b), the separation between the objects has been increased so there is a pixel of separation between them in the image. This pattern-a pixel on, a pixel off, and a pixel on-is referred to as a line pair and is used to define the pixel-limited resolution of the system. Most often, the size of the line pair is expressed in terms of a frequency of line pairs per millimeter (lp/mm). The resolution of a particular lens is expressed as a frequency in image space, to relate back to the size of the pixels. For example, a camera sensor with 3.45 micron pixels represents a pixel-limited resolution of 145 lp/mm so that a lens needs to resolve at least this frequency for the system to obtain maximum resolution.
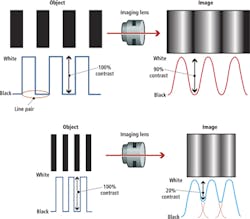
For two lenses with the same resolution, image quality is determined by how each lens preserves contrast-the separation in intensity between black and white lines-as these lines become progressively narrower (or higher in resolution). The higher the resolution, the more difficult it is for a lens to produce a high contrast, sharp image at that frequency.
In a theoretically perfect lens, the maximum obtainable resolution is dictated by the f/# and the wavelength where the lens is being used. The smaller the f/# and wavelength, the higher the theoretically-obtainable resolution. Figure 2 shows how an increasing frequency degrades the contrast of the image formed by a lens. The top of Figure 2 shows a lens imaging an object that has a relatively low spatial frequency, while the object on the bottom has a higher spatial frequency. After passing through the lens, the upper image has 90% contrast while the bottom image has only 20% contrast.
Modulation Transfer Function
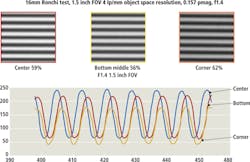
The ability to measure a lens's performance with respect to resolution and contrast is paramount for a machine vision system designer. However, it is not as simple as measuring contrast at a given resolution. The contrast at which a lens will reproduce a given resolution is dependent on resolution and on the field position (image height), as shown in Figure 3.
In Figure 3, three image positions are shown; the center (often referred to as on-axis), bottom middle, and the corner. The lens reproduces contrast differently at each of these positions, even though the frequency is the same. Essentially, what are being displayed are snapshots of the Modulation Transfer Function (MTF), which is measurement of the ability of an optical system to reproduce contrast at a given frequency.
Representing the image performance of a lens using the format shown in Figure 3 is disadvantageous, primarily because it only shows how the lens performs at a single frequency, and comparing lenses against each other would be challenging if the only available data was at a single frequency. To circumnavigate these limitations, there are graphical ways to demonstrate the MTF of a lens (Figure 4). Three different field points are shown: blue for on-axis, green for an intermediate image height (analogous to the bottom middle) and the corner image position. The difference between the dashed and solid lines represents how the lens reproduces contrast in the tangential (solid) and the sagittal (dotted) planes.
While a useful metric to determine an imaging lens's performance, there are several variables that comprise an MTF curve, namely the lens's working distance, f/#, wavelengths of light used and the size of the image sensor used with the lens. Be wary of comparing two MTF curves, or using an MTF curve that has not been expressly created with respect to the conditions of the intended use of the lens.
Lenses will have vastly different MTF values at different parameters and a single MTF graph will not relay theses subtleties. Lens manufacturers should provide specific MTF curves at detailed specifications and occasionally the prescriptions to the lenses themselves to any system designer upon request.
Depth of field
Depth of field is the difference between the closest and furthest working distances an object may be viewed before an unacceptable blur is observed. The aperture stop number (f/#) of the lens helps to determine the depth of field. The f/# is the focal length of the lens divided by its effective diameter and, for most lenses, is specified at an infinite focal length. As the f/# is increased, the lens collects less light.
Reducing the aperture increases depth of field (Figure 5). The purple lines show the depth of field and the yellow lines indicate the maximum allowable blur (generally considered to be the size of a pixel, but can also represent a specific resolution). Increasing the allowable blur also increases the depth of field. The best focused position in the depth of field is indicated by the green line.
Figure 6 shows a depth of field target with a set of lines on a sloping base. A ruler on the target makes it simple to determine how far above and below the best focus the lens is able to resolve the image.
Figure 7 shows the performance of an 8.5 mm fixed focal length lens that is used in machine vision applications. With the aperture set to f/1.4, looking far up the target in an area defined by the red box, there is a considerable amount of blur. With the aperture closed to f/8, the resolution at this depth of field position increases. The lines are crisper and clearer and the numbers are now legible. But when the iris is closed to f/16, where there is very little light entering the lens, the overall resolution is reduced and the numbers and lines both become less clear.
The above example shows an important nuance of depth of field that is often overlooked. While the 8.5 mm lens in Figure 7 showed poor depth of field with the lens open to f/1.4, it was also unable to resolve the same depth of field at f/16. The depth of field was greatest at f/8, seemingly contradicting the image in Figure 5, which shows the depth of field as increasing with an increasing f/#.
In reality, the other issue at play is the overall resolution of the lens. As briefly mentioned above, a lens's maximum attainable resolution is determined in part by its aperture. The smaller the aperture (higher the f/#), the lower the maximum resolution. As can be seen in Figure 7, the aperture has been closed too much, effectively disabling the lens from resolving the frequency. When selecting the f/# of the lens for any machine vision system, this tradeoff between depth of field and maximum resolution must be considered.
Distortion effects
Figure 8 shows an example of radial distortion, an optical error or aberration resulting in a difference in magnification at different points within the image. The black dots show the position of different points in the object as seen through the lens while the red dots show the actual position of the object. Distortion can sometimes be corrected by a software system that calculates where each pixel is supposed to be, and moves it to the correct position.
Perspective distortion (parallax) is the illusion that the further an object is from the camera, the smaller it appears through a lens, and is caused by the lens having an angular field of view. Perspective distortion can be minimized by keeping the camera perpendicular to the field of view and further minimized using a telecentric lens. These lenses maintain magnification over the depth of field, thus eliminating perspective distortion.
Figure 9 shows an object (top) captured using a fixed focal length lens (bottom left) and a telecentric lens (bottom right). Using a conventional fixed focal length lens, the two parts appear to be different heights even though they are exactly the same height. In the image on the lower right, the telecentric lens has corrected for perspective distortion and the objects can be measured accurately.
Nicholas Sischka, Optical Engineer, Edmund Optics (Barrington, NJ; www.edmundoptics.com) and John Lewis, Global Content Marketing Manager, Cognex Corp (Natick, MA; www.cognex.com).


