Waveform monitors speed video signal analysis
Waveform monitors, vector scopes, and digital oscilloscopes allow engineers to perform sophisticated tests on video signals.
By Andrew Wilson,Editor
Whether they are analog, composite, component, or digital, today's video standards have emerged from the over sixty-year history of the television industry. Color cameras, frame grabbers, and displays use these standards as a basis for image capture, transmission, and display. These may include analog RGB, composite signals such as NTSC, PAL, and SECAM, or component signals such as YIQ.
Over the next few years, however, these standards will be surpassed by digital video and transmission techniques that encompass the MPEG-2 standard. And, just as the synchronized oscilloscope gave way to the vectorscope and waveform monitor, digital standards will demand new methods of testing and new forms of test equipment.
VIDEO TEST EQUIPMENTIn testing whether imaging equipment conforms to composite video standards, test signal generators must be used to guarantee stable, measurable input video signals. Available from a number of manufacturers, these generators provide a number of different video output standards including analog, composite and digital standards (see "Off-the-shelf test equipment qualifies video systems, Vision Systems Design, Sept. 1998, p. 78).Where signals from cameras, frame grabbers, or display controllers are output as analog RGB signals, an oscilloscope can test such features as signal amplitudes. For measuring composite video signals, however, the use of a waveform monitor may be required. In operation, the device being tested is presented with a composite video signal from a test-signal generator. The output, which is input to a waveform monitor, draws a vertical graph of the voltage of the composite video signal over time.
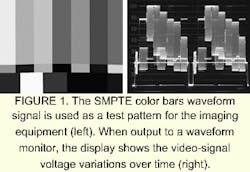
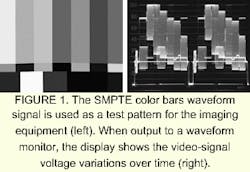
In many cases, the Society of Motion Picture Television Engineers (SMPTE) color bars waveform signal is used as a test pattern for the imaging equipment. When output to a waveform monitor, the display shows the video signal voltage variations over time (see Fig. 1). Tektronix (Beaverton, OR), perhaps the best-known manufacturer of pattern generators, waveform monitors, and vectorscopes, offers its VM700—a combined digital waveform monitor and vectorscope.
In waveform mode, the unit provides graphics displays of the video signal, allowing measurements to be made manually. Measurement cursors are available to measure time, frequency, and amplitude parameters of a video signal. As well, waveform display can be expanded around any point both vertically and horizontally.
Such waveform monitors display the luminance component of the composite video signal as a series of voltages that determine the brightness variation across the image. Each of the color bars has a different luminance level, and the bars are arranged from highest to lowest. On the waveform monitor display, the first bar is white and has no chrominance. All the other color bars should have the correct amount of chrominance amplitude to produce a 100% saturated color.
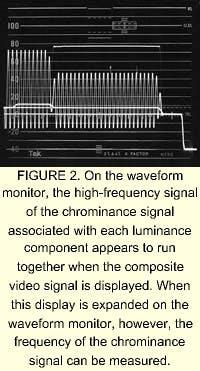
Because of the high frequency of the chrominance signal associated with each luminance component, the signal appears to run together when the composite video signal is displayed. When this display is expanded on the waveform monitor, however, the frequency of the chrominance signal can be measured (see Fig. 2). If chrominance amplitudes are incorrect with respect to the corresponding luminance, the image's color intensity or saturation is affected.
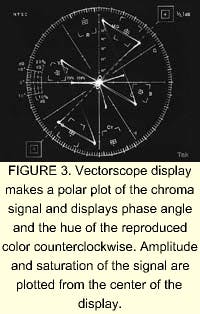
ENTER THE VECTORWhile a waveform monitor displays amplitude information about all parts of the composite video signal, vectorscopes determine the chrominance part of the video signal. Like the waveform monitor, the vectorscope is designed to evaluate these color signals using the SMPTE color-bars signal. However, rather than graph the voltage versus time of the video signal, the vectorscope plots the amplitude of the chroma signal as a radius whose amplitude is plotted outward from the center of the screen.When the color-bars signal is applied to the input of a vectorscope, the primary colors red, green, and blue and their complements—cyan, magenta, and yellow—are represented as product vectors on the instrument's display. Because the color-difference signals of the white and black components of the SMPTE color-bars signal are all zero, these "colors" have no effect of the display.
In operation, the vectorscope makes a polar plot of the chroma signal and displays phase angle and hue of the reproduced color counterclockwise. Amplitude and saturation of the signal are plotted from the center of the display (see Fig. 3).
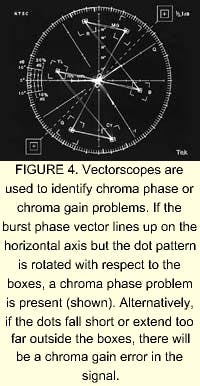
Calibrated to locate the phase angle and amplitude locations of the primary and complementary colors of the SMPTE signal, vectorscopes rapidly identify chroma phase or chroma gain problems. If the burst-phase vector lines up on the horizontal axis but the dot pattern is rotated with respect to the boxes, for example, a chroma phase problem is present (see Fig. 4). Alternatively, if the dots fall short or extend too far outside the boxes, there will be a chroma gain error in the signal.
Designed to be used with the company's Model 5860C waveform monitor, the 5850C vectorscope from Leader Instruments (Hauppauge, NY) is typical of many vectorscopes. Accepting a phase reference from either of two inputs or from an external composite video, the unit's electronically generated scale of coarse- and fine-error limits allow video adjustments from relatively large viewing distances. An illuminated internal graticule facilitates differential gain and phase measurements.
In the development of its TVM-821D, Videotek (Pottstown, PA) combined the functions of a waveform monitor and a vectorscope into one unit. In operation, the unit can display up to three NTSC or PAL composite video signals individually or in combination. Vector displays can also be overlaid for simultaneous observation and comparison of the phase and amplitude of three signals.
MOVING TO DIGITALWhile many cameras, frame grabbers, display controllers, and monitors incorporate broadcast-like standard to digitize, display, and store images, designers are now beginning to incorporate serial digital transmission standards into their products. Rather than transmit analog, component, or composite video from cameras to frame grabbers, for example, camera and board-level vendors are beginning to harness low-voltage differential signaling and other digital standards for high-speed image transfer.Last month, for example, Datacube (Danvers, MA) announced that its MaxVideo 2000 product would incorporate six Gigabit Ethernet channels to transfer data at rates of up to 1.2 Gbytes/s to a contiguous 2-Gbyte on-board memory (see Vision Systems Design, Sept. 2000, p. 70).
To determine if serial digital video data are transmitted correctly, an important parameter that must be measured is jitter. While data-dependent jitter is caused by a pattern of data bits preceding the current bit in the data stream, random jitter is due to random noise in a system. By measuring serial digital video and triggering on repetitive data patterns and measuring the variation in edge placement, deterministic jitter can be determined. Similarly, random jitter can be characterized and measured by statistically analyzing the digital waveform.
To measure such high-speed signals, Tektronix has introduced the TDS7000 range of digital phosphor oscilloscopes. Ranging from 500-MHz to 4-GHz bandwidth with single-shot sample rates to 20 Gsamples/s, the scopes are designed to meet demands of the latest high-speed logic families and multigigabit communication standards. In the TDS7000 series, jitter analysis to 1 ps (rms) is achieved through sophisticated triggering and data acquisition, deep memory.
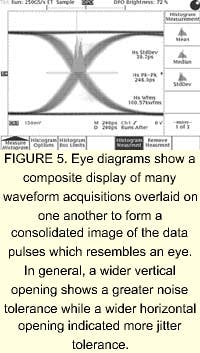
One waveform that the TDS7000 series can display is the eye diagram (see Fig. 5). This display is a composite display of many waveform acquisitions overlaid on one another to form a consolidated image of the data pulses, which resembles an eye. In general, a wider vertical opening shows a greater noise tolerance while a wider horizontal opening indicates more jitter tolerance. Thus, the wider the eye, the better.
BROADCAST GOES DIGITALWhile many image-processing and machine-vision vendors are likely to adopt digital-transmission standards based on camera or digital networking standards, broadcast vendors are moving in a different digital direction. Typically, a satellite transponder of between 24 and 27 MHz can only handle a single analog video feed. To increase the number of feeds without image compression would involve increasing the number of transponders and thus increasing costs.To overcome this problem and to allow for a large number of video and audio channels to be transmitted across existing cable and satellite networks, the broadcast industry's digital video broadcast project has adopted the MPEG-2 as the standard for transmission and compression of video and audio. MPEG-2 has many profiles and layers to allow a number of increasingly higher resolution images to be transmitted (see Vision Systems Design, Feb. 1999, p. 35).
With the adoption of this format, designers and developers require a means to test and analyze the transport data streams captured from MPEG-2 coders and decoders. Because of this, manufacturers such as Tektronix have introduced products such as the MTS-100, an integrated analyzer for MPEG-2 data streams. In operation, the analyzer dissects the MPEG-2 transport stream and graphically presents its content. Because the display is graphical in nature, it helps the designer trace and access individual signal components and shows how these elements are combined in the transport stream.
Just as the broadcast industry adopted analog, composite, and component technologies, it is certain that some areas of the vision-systems marketplace will follow suit. In applications where image compression may not affect the outcome of image analysis, it is certain that developers will adopt these new broadcast standards. In other applications where artifacts introduced through image compression may be unacceptable, it is more likely that lossless digital high-speed network standards will be embraced.
ACKNOWLEDGEMENTThe author would like to thank the technical staff at Tektronix (Beaverton, OR) for help in preparing this article.Company InformationDue to space limitations, this Product Focus article does not include all of the manufacturers of the described product. For information on other suppliers of test and measurement equipment, see the 2000 Vision Systems Design Buyers Guide (Vision Systems Design, Feb. 2000, p. 93.Datacube
Danvers, MA 01923
Web: www.datacube.com
Leader Instruments
Hauppauge, NY 11788
Web: www.leaderusa.com
Tektronix
Beaverton, OR 97077
Web: www.tek.com
Videotek
Pottstown, PA 19464 l
Web: www.videotek.com
