Machine vision inspects solar panels at high-speed
Multiple cameras and lighting configurations are used in a system to inspect the position and orientation of solar cells and determine whether any chips, cracks, bus-bar gaps or ink stains are present.
Paul Sommers and Matt Pinter
Solar cells are electronic devices which directly convert sunlight into electricity. Light shining on the solar cell produces an electric current. To transfer this current from the cell, a grid of fingers on the cell collects the electrons and transfers them to bus bars.

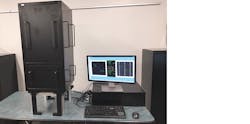
Figure 1: To inspect photovoltaic cells, ATS Automation Tooling Systems has developed an inspection workstation that uses a combination of back and front illumination, multiple cameras and the company’s own PC-based SmartVision software.
Bus bars and fingers are produced by screen printing a conductive ink in a series of lines on the surface of the cell. This printing process can result in lines that are damaged or missing due to contamination on the screen print surface, a damaged screen or low ink levels that will cause reduced power to be produced by the cell. Once these cells are screen printed, they are baked in an oven to harden the ink, after which the cells cannot be reworked to repair any damaged lines.
ATS Automation Tooling Systems (ATS; Cambridge, ON, Canada; www.atsautomation.com) has developed an inspection workstation that inspects the surface of solar cells using a combination of back and front illumination, multiple cameras and the company’s own PC-based SmartVision software (Figure 1). ATS has built lower resolution solar cell inspection systems in the past but newer generations of cells are utilizing thinner “fingers” on the cell surface. This requires higher resolution cameras in order to have enough resolution in order to check the print quality of the fingers on the cell surface.
In this case, the end customer required a pixel resolution of less than 20 microns across a field of view of 180 x 180mm. This required an image of 9000 x 9000 pixels or greater.
Illumination
Solar cells are transported into the inspection station on a conveyor at a rate of one cell every two seconds. They are held flat using a vacuum fixture under the conveyor. The array of four cameras each takes two images of the cell. The first set of images is taken with a backlight and the second set is taken with front lighting.
A DLP backlight from Smart Vision Lights (Muskegon, MI, USA; www.smartvisionlights.com) is positioned beneath the conveyor and a set of diffuse bar lights from CCS America (Burlington, MA, USA; www.ccsamerica.com) are positioned around the edges of the cell. The first set of images is illuminated only with the back light and is used to locate the position and orientation of the cell as well as detect cracks in the cell surface or chips along the edges.
The second set of images is taken with the bar lights on. These are diffuse lights that produce a very even brightness across the surface of the solar cell. This highlights the fingers and bus bars against the black surface of the cell. The cell surface is inspected for gaps that may be present in the ink of the bus bars and fingers, surface ink stains and whether the correct number of fingers is present on the solar cell surface.
To capture an image of the backlit solar cell, the camera mount assembly used in the system employs four 5120 x 5120 Camera Link cameras from ISVI (Gyeonggi-do, South Korea; http://isvi-corp.com) that are arrayed in a 2 x 2 grid (Figure 2). In order to achieve the required pixel resolution of less than 20 microns per pixel over the 180mm field of view, it was necessary to combine the images from four cameras into a single 10K x 10K image (100 MPixels). To allow for any variation in the position of the solar cell located under the imaging system, each camera has a field of view of 90 x 90 mm (3.54” x 3.54”). This is achieved using 50mm Xenon 2.8/50 lenses from Schneider Optics (Hauppauge, NY, USA; www.schneideroptics.com) that are positioned at a distance of 205 mm from the surface of the solar cell.
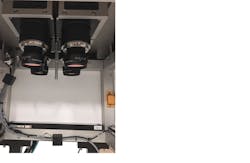
Figure 2: Using a camera system mounted above the solar cell, the system uses a flat backlight to determine the position and orientation of the cells and an off-axis bar light configuration to detect any bus bar gaps, ink stains and the number of fingers on the cell.
Each camera inspects one quadrant of the solar cell and the images from these cameras are transferred over a Camera Link camera -to-computer interface to a host PC. The PC contains a pair of Radient eV-CL Dual Full Camera Link PCIe frame grabbers from Matrox Imaging (Dorval, QC, Canada; www.matrox.com/imaging).
Because the solar cells are violet in color, red light is used, since it will be absorbed by the cell and appear black to the camera. The ink is highly reflective in red light, so the fingers and bus bar lines appear with high contrast in the captured image.
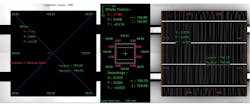
Figure 3: After the cells are illuminated by the backlight and the image transferred to the host PC, their position and orientation must be verified and the cells must be inspected for any chips and cracks that may be present at the edges.
This also eliminates the “crystalline” appearance of the cells as they appear in white light. A custom lighting hood was designed and manufactured by ATS to evenly illuminate the solar cells with the red light.
Image analysis
After the images are transferred to the host PC, custom image processing software is used to “stitch” the four individual images into one large image. The cameras are calibrated to one another using a custom calibration fixture and a combination of ATS SmartVision software and Matrox MIL libraries. Two complete 100 MPixel images of each solar cell are produced: one backlit and one front lit (Figure 3).
The inspection software locates the cell position and orientation within the backlit image. It also inspects the cell for cracks in the surface or chips around the edges. The frontlit image is then analyzed to verify the integrity of the fingers and bus bars on the cell surface. Custom imaging tools with ATS SmartVision are used to check the ink for gaps, thick and thin regions (Figure 4).
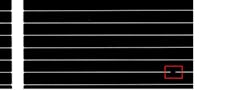
Figure 4: To analyze every pixel of each row of ink for gaps, thick and thin regions of the solar cell, the cell is imaged with the red bar lights. Then, a series of Dispense Tools were used from the ATS SmartVision software to analyze every pixel of each row of ink.
Aset of inspection data is reported to the PLC for each cell that is inspected. Rejected cells are sent to a reject lane and removed from downstream processing. Passed parts are then classified and sorted to ensure that the final solar panels contain a balanced set of individual cells within their cell array, and are all within a specified power tolerance range.
Companies mentioned:
ATS Automation Tooling Systems (ATS)
Cambridge, ON, Canada
www.atsautomation.com
CCS America
Burlington, MA, USA
www.ccsamerica.com
ISVI
Gyeonggi-do, South Korea
http://isvi-corp.com
Matrox Imaging
Dorval, QC, Canada
www.matrox.com/imaging
Smart Vision Lights
Muskegon, MI, USA
www.smartvisionlights.com
Schneider Optics
Hauppauge, NY, USA
www.schneideroptics.com
Paul Sommers, Senior Imaging Engineer, ATS Automation Tooling Systems, ATS; Cambridge, ON, Canada, and Matt Pinter, Director of Engineering, Smart Vision Lights, Muskegon, MI, USA