Pathologic systems exploit image analysis to speed diagnosis
Pathologic systems exploit image analysis to speed diagnosis
By John Haystead, Contributing Editor
Pathology, the recognition and identification of structural changes in cells and tissues caused by disease, is a complex, tedious, and labor-intensive task. It consists of two disciplines: cytology, the study of isolated cells in body fluids, and histology, the study of tissues. To investigate these cells and tissues, pathologists must visually evaluate and interpret hundreds of thousands of samples each year. Given this volume, it is not surprising that the rate of false-negative "Pap smear" tests for cervical cancer averages 15%-20%.
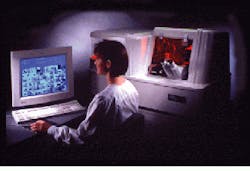
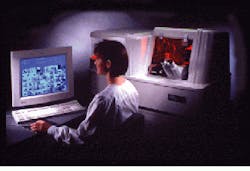
Fortunately, image-analysis tools promise to automate much of these tasks and improve the quality and consistency of testing. One such system, the Automated Image Management System (AIMS) from AutoCyte (Elon College, PA), combines sample images from microscopes and images of large- tissue specimens from grossing stations.
Developed in conjunction with the University of Pittsburgh, (Pittsburgh, PA), the AIMS has been in beta test for nearly two years. "Recognizing that pathology is an image-intensive practice of medicine, our goal was to automate the image-analysis process," says Dr. Michael Becich, associate professor of pathology and director of pathology and oncology at the university. By combining pathology images with patient data and imagery from radiology, microscopy, and ultrasound sources, such systems provide physicians with digital images of a patient`s health.
Image acquisition
Running under Windows NT, the AIMS analysis system can be configured in both low- and high-resolution workstation and grossing workstation versions. Each system uses a Pentium PCI/ISA 200 computer, 1.6-Gbyte SyJet removable drive from SyQuest (Fremont, CA), a Courier 28.8-kbit/s modem from US Robotics/3Com (Santa Clara, CA), and a Millennium 4-Mbyte PCI VGA card from Matrox (Dorval, Quebec, Canada) to perform image-capture and analysis functions. However, the low-resolution workstation uses a DXC 970MD analog 640 ¥ 480 CCD camera from Sony (Park Ridge, N.J), while the high-resolution workstation uses a ProgRes 3012 digital camera from Jenoptik (Eching, Germany), with an optional Axioskop microscope from Zeiss (Thornwood, NY) that features 2.5X-40X magnification. The software-programmable camera can capture images from 192 ¥ 145 to 3072 ¥ 2320-pixel resolution.
AutoCyte`s grossing workstation uses the same camera as the high- resolution workstation but uses a Sony/Fujinon lens system and RM930 lens controller. Analog CCD cameras are supported by a Matrox Meteor RGB PCI frame-grabber board with 640 ¥ 480 CCD resolution. The board supports 8-bit monochrome, 15-bit RGB, and 24-bit color grabbing with independent gain and offsetcontrol for each color channel. Image management
AIMS software stores images and data in one of three user-definable libraries. Information, such as patient demographics, diagnosis comments, specimen information, and images are organized by folder tabs displayed across the top of the main window. A specimen- classification table categorizes images by keywords such as colon and/or malignant, while another table relates these to physicians` names and contact information. Similarly, a diagnosis text table maintains a list of standardized descriptions of final diagnoses. This reduces data-entry time and provides consistent terminology within each institution.
Images can be stored in one of 30 different user-selectable image formats with or without image compression. To ensure that they are properly coded, raw images are stored in a compound file format together with annotations and embedded OLE objects. Additional security is provided via CRC error checking. Images can be incorporated into reports or transmitted to remote specialists for consultation. System software also incorporates annotation tools from AccuSoft (Westborough, MA) that can create objects for highlighting certain areas of an image and Crystal Reports templates from Seagate Software (Scotts Valley, CA) that generate custom reports.
According to George Naxera, AutoCyte product manager, integrating data with existing databases is a critical requirement for most pathology users. Access database software from Microsoft (Redmond, WA) is supplied with the system but can be configured for use with other Open Database Connectivity standard databases. More than 30 database tables and 90 fields of information can be queried. Using Boolean logic, queries can be performed using multiple search parameters on multiple fields from different tables. AutoCyte is also working with Dynamic Healthcare Technologies (Maitland, FL) to integrate the AIMS system with Dynamic`s patient-database systems.
Automated testing
Although image-collection and archiving tools are important case-management aids for pathologists, before image-processing technology can be applied to automated testing, quantitative evaluation techniques must be developed. "Quantitative pathology techniques enhance detection of tumors by measuring specific parameters such as variations in size and shape and proliferation rates," says Dr. Thomas Gahm, AutoCyte vice president of software development and system integration.
AutoCyte has developed a number of automated tools now being used in cytology, and Gahm sees many of these being applied to pathology. These include tools for automated slide preparation and tracking. Developed to partially automate the slide preparation process prior to cytological analysis, AutoCyte`s PREP system uniformly distributes the epithelial-cell samples in a single, circular monolayer field on the slide to ensure homogeneous cell density. The slides are then stained and placed in cassettes for evaluation by the Screen automated cytology prescreening system.
To automatically track slides, AutoCyte`s Screen microscope system allows all of the slides in a carousel rack to be individually read and tracked by a barcode reader. By querying and comparing each slide image against a 280- feature data set, algorithms can identify the most-abnormal cells on the slides and display the slides in a cell gallery on the computer screen where the cytotechnologist can determine whether they require further review by a pathologist.
Although the Screen and Prep systems were originally developed for UNIX platforms, they can now be integrated with the PC-based AIMS system and integrated with other hospital laboratory information systems and patient databases.
Because these tools are of modular design, users can mix and match modules in the AIMS system to build a variety of pathology workstations. "Although cytology has been moving steadily toward full automation, new capabilities must be added as pathologists become more comfortable with basic tools," says Gahm. Dr. Becich agrees, pointing out that while some capability exists today for cytology and hematology, thick sections of solid tissues are much more com plicated to define and evaluate. "We are probably three to five years away from a U. S. Food and Drug Administration-approv ed pro cess for these technologies in pathology, but we are moving out of the visionary and into the rapid-adoption phase," he says.
Clinical applications
AutoCyte is also developing clinical applications to diagnose cancer and other diseases via in situ DNA and S-phase fraction analysis to determine the multiplication rate of cells. Both techniques allow analysts to determine the malignancy potential of certain tumors. For example, analyzing the number of chromosome sets in the nucleus of a cell is useful in classifying tumors.
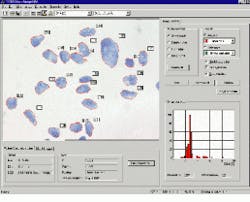
After marking the specimen with a DNA-specific stain, AutoCyte`s Quantitative Image Cytometry QUIC-DNA system uses integrated optical density techniques to measure the amount of stain present (see Fig. 1). Because, in aggressive tumor cells, entire or portions of chromosomes will be missing, their DNA content will also be reduced, distinguishing them from normal cells. The system is calibrated against specimens of known density values and trained to compare the samples against these references.
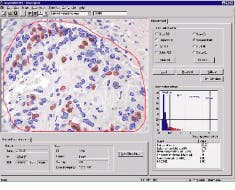
Antibody and analysis techniques are also used to identify the origin, prognosis, and method of treatment of affected cells. Because the extent to which tumors respond to hormone treatment is related to the number of hormone-receptor sites on the cell membranes, identifying tumors rich in receptors allows the pathologists to determine the best treatment. AutoCyte`s QUIC-Immuno system allows pathologist to quantitatively analyze the number of these hormone receptors and their proliferation rates in both histological sections and single cell preparations (see Fig. 2).
While these systems look primarily at individual cells, AutoCyte`s Topography system grades tumors in histological sections by describing complex tissue architectures. Mimicking the process of the pathologist, the system describes the arrangement of cells in tissue, noting certain features such as the distance between cells. In normal tissue, cells are usually arranged in a homogeneous fashion, whereas tumorous tissues generally display a distinctive heterogeneity.
Image-based queries
"Content-based image query and analysis, identifying features from the images themselves rather than from associated text, is the holy grail of pathology," says Becich. "Given the value already associated with the associated textual descriptions, we can only imagine how valuable image-based query will be to pathologists," he adds.
AutoCyte is also examining image-based query technology, but, questions remain as to where this technology is best located in terms of institutionwide database systems. "Depending on the extent to which our systems are integrated with larger patient databases, such queries may be better handled in those systems," says Gahm.
Image-based query systems will need to be designed for efficient operation. "Given the sheer volume of data, you do not want to have images stored in the database. Instead, you need data-reduction techniques and a pointing structure linked to images outside of the database via query engines," says Gahm.
Because users want to compare unknown image parameters with known prototype references, sophisticated feature-extraction tools will also be essential. "The first step is to perform a quantitative description and evaluation of the image. Although this is occurring in cytology and, to some extent, in histology, additional development is necessary," says Gahm.
AutoCyte`s Screen cytology prescreening system identifies abnormal cells by querying and comparing against a 280-feature data set. These cells are then displayed for further evaluation by the cytotechnologist. The system is currently undergoing FDA review for use in cervical-cancer screening.
FIGURE 1. QUIC-DNA performs quantitative analysis of DNA, nuclear texture, and morphology. DNA analysis assesses the aggressiveness of various types of tumors. Shown are breast-tissue cells. Individual cells are automatically selected and highlighted in red according to user-defined criteria and the data compiled in histogram form in the lower right corner of the screen. In operation, the system displays a histogram of the DNA content of nuclei measured through image optical density. Trained users can immediately identify aggressive tumors based on the location and number of spikes in the histogram. A normal cell will have a large spike at 2C (chromosome pairs) and a small spike at 4C. Significant activity at 6 or 8C indicates aggressive tumors.
FIGURE 2. QUIC-Immuno aids patient management and prognosis through quantitative analysis of hormone receptors and proliferation markers in histological sections and single cell preparations. The large window shows a live image of a breast-tissue sample, within which the operator has circled a region of interest in red. By clicking the process all button, all cells within the region meeting specific criteria input by the user are automatically selected (outlined). The data is then compiled and interpreted in the histogram shown in the lower right window. The graph shows the number of cells that have been positively marked by stain.


