MODELING optical vision systems WITH INNOVATIVE SOFTWARE
MODELING optical vision systems WITH INNOVATIVE SOFTWARE
By Michael Stevenson and Marie Côté
Virtual simulation of optical vision systems has previously been a cumbersome design task that often yielded less-than-desirable characterizations. However, recent efforts toward fabricating a synergy between a computer-aided-design (CAD) package and an optical-analysis engine have introduced new pathways for approaching the computer simulation of optical
vision systems. Among the different types of available optical vision systems is one common goal: they all concentrate on producing high-quality images. By designing computer models of these systems, they can be readily fine-tuned or even constructed--a process that saves time, effort, and money.
Quality-control optical vision systems can be conveniently simulated and analyzed using software technology--for example, a system that evaluates circuit boards for microchip position and etching defects. Hot spots formed by microchip leads and imaged onto a charge-coupled-device (CCD) camera would be used to verify their position within an appropriate tolerance range. If the wrong camera is used or misplaced, the optical-vision system may not be able to resolve a usable image. Furthermore, if a light source is too bright or poorly placed, the lighting may not be suitable for creating the flux differentiation needed to identify the microchip leads. Joining the Advanced Systems Analysis Program (ASAP)--an optical and illumination, analysis, and design tool from Breault Research Organization Inc. (Tucson, AZ)--and Rhinoceros--a three-dimensional (3-D) graphical design program from Robert McNeel & Associates (Seattle, WA)--results in a combination of tools that can simulate and analyze almost any optical-vision system with high geometric and photometric accuracy.
The ASAP software package combines 3-D entity modeling, macro programming, Gaussian beam propagation (for coherent source modeling), and nonsequential ray-tracing with automatic splitting of rays into specular, diffracted, and scattered components. This analysis program can generate radiance maps, isocandela plots, initial exchange-specification standard outputs, spot diagrams and modulation transfer functions, irradiance and power distribution plots, overlaid ray traces, as well as two-dimensional (2-D) and three-dimensional system profiles. These features enable designers to visualize all the key elements of their system`s optical performance. Moreover, they serve as a method for reducing or even bypassing experimental design and prototyping.
As a 3-D graphical design software tool for modeling complicated system geometry, Rhinoceros offers features for deriving unconventional objects, including surface bending, blending, and patching, as well as uniform and nonuniform scaling in any combination of dimensions. Modeling objects without a visual design interface can be time-consuming and problematic. In addition, it takes the power of a 3-D modeling package to characterize most surface blends that are not rotationally symmetric.
Optical systems--sources in particular--often lack axial symmetry. The Rhinoceros modeling package serves as a platform to characterize these systems. When making a CAD model, system geometry can be graphically verified at any stage of the design process. The capability of visual geometry inspection greatly reduces dimensional design error. Creating asymmetric surface blends and patches involves some degree of experimentation, during which this type of graphical inspection proves useful.
Rhinoceros and ASAP share a common initial-graphics-exchange-specification (IGES) format. This allows objects characterized in the Rhinoceros 3-D modeling program to be imported into ASAP for further analysis. When a system is modeled in this CAD program, it is composed of objects that are described by nonuniform rational B-spline (NURB) curves. These NURB objects have no explicit equation-based global definition. Instead, their physical definition is a set of control points that can be moved to position the object or altered to change the object`s shape. By avoiding explicit characterization, Rhinoceros can form shapes that could not otherwise be easily defined.
The B-spline curves, which are the mathematical underpinning of CAD objects, are interpreted as Bezier curves when translated to ASAP. To regulate object complexity, ASAP uses nothing higher than second-order Bezier curves; the number of curves used in object definition is directly proportional to object complexity. Once systems have been imported into ASAP, optical properties are applied to all components as the final preparation before rays can be traced through the system.
Virtual system geometry
To illustrate the simulation capabilities of ASAP and Rhinoceros, consider the vision-design task of building a complex model of a car that is to be imaged by a camera collecting reflections from an off-axis source. The fundamental purpose behind the simulation of this type of system is defined by the worth of a detailed virtual system model. A working model of any system allows for a complete analysis of the system`s optical performance. This type of analysis also permits designers to dissect the functionality limitations inherent to their system. In this situation, it is possible to decide the proper light-source intensity and position, imaging camera position, depth of focus, effective focal length, field of view, and CCD camera resolution. To develop this type of quality-control optical vision system by trial and error would be a costly exercise if done by any method other than computer simulation.
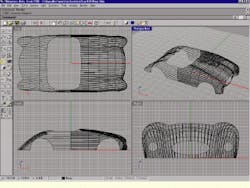
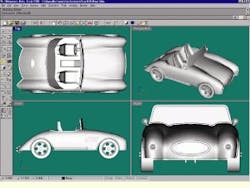
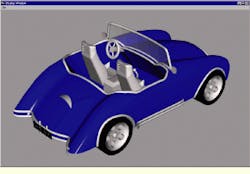
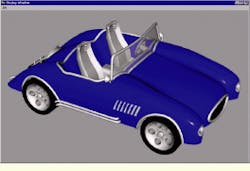
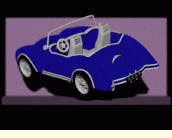
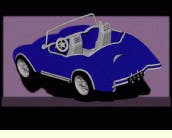
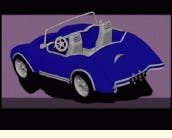
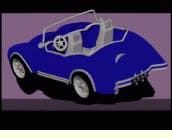
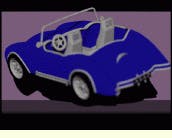
In the initial design step, several cross sections of the concept car`s body are made. These curves are then lofted to form the body of the car. Using many of the CAD program`s blending and solid formation features, and about 500 objects later, the car is completed with wheels, seats, and trim. Final preparation of the car model involves shrinking it by a uniform 3-D scale factor until it is the size of a matchbox toy. The entire process takes about 10 hours of uninterrupted freehand modeling. For a new Rhinoceros user, building the car model would take about twice that time. Upon completion of the model, the render option is used to create color images of the car (see Fig. 1).
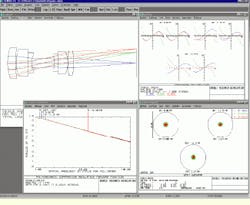
The next design step is the simulation of the optical vision system needed to image the model car. For the purposes of this project, a diffraction-limited, double-Gaussian imaging system is modeled (see Fig. 2). The ZEMAX software tool from Focus Software (Tucson, AZ) is used for the lens-design process. This program`s interface and optimization features help accelerate this part of the simulation.
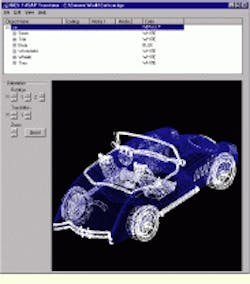
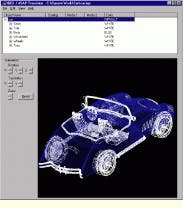
After both the car and the optical vision system are modeled, the next step is to import or translate them into ASAP via two independent translators: an IGES translator for the CAD entities and a ZEMAX translator for the lens entities (see figure on p. 29). Though most of the optical vision system could have been constructed within ASAP, the CAD and lens-design software ease the preparation of system geometry into the optical-analysis engine.
Virtual analysis
With the geometry of both models programmed into ASAP, the next step is the assignment of optical properties. The car`s objects are each given unique optical properties for certain stages of the analysis. For instance, the car`s windshield is given a Harvey-Shack scatter model, and the objects forming the car receive Lambertian scatter models with varying values of reflectance based on their color. To allow for visibility of shadows cast by the car and proper viewing of dark objects, a scene is added within ASAP and positioned behind the car.
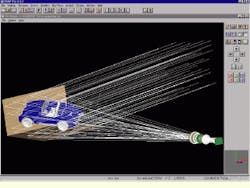
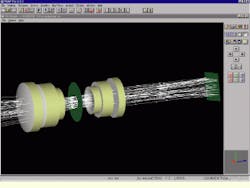
With all these design steps successfully completed, the optical-vision-system geometry and light-source position are verified using the ASAP 3-D Viewer (see Fig. 3). To do this, a small number of rays from an off-axis collimated light source are traced onto the model car. Rotating the optical system and its source makes it possible to confirm complete illumination of the target (car) object. The optical system is then ready for a large-scale imaging ray trace.
Creating a color image of the model car by nonsequential ray-tracing requires three individual traces at the red, green, and blue (RGB) primary wavelengths without changing the location of the optical vision system or the target. The objects of the car and background scene are then divided into four color groups: plum, white, black, and blue.
For each of the three traces, all objects are given Lambertian scatter properties, with their reflectivity governed by object color. This is a common method for defining color and is known as the application of an RGB model. For example, the plum color is defined by primary reflective values of red = 55%, green = 40%, and blue = 55%. To define the blue body of the car, the RGB model is red = 0%, green = 0%, and blue = 100%.
The white objects are given reflective values of 100% for all three primary color traces, whereas the black objects are given no reflective properties for any of the three traces. Figure 4 reveals that all of the car objects except the tires reflect the incident rays during the blue wavelength ray trace. There are no rays traveling through the entrance pupil of the system`s CCD camera from the tires or obstructed regions of the scene.
After the assignment of reflective properties, 8 million rays are traced for each color. From the source, the rays proceed onto the objects comprising the scene and the car. At this point, the rays are scattered toward the entrance pupil of the camera and imaged onto a detector plane with a 480 by 640-pixel resolution. Each of the detector`s pixels serves as a bucket for incident rays. The number of rays collected by each pixel determines the pixel`s color. This method establishes a highly accurate portrayal of what the CCD camera sees as an image. In this simulation, the detector plane replaces the CCD camera. Upon completion of the three traces, the results are combined to form a full-color image from its primary colors.
Interpreting results
Overall system performance can be assessed from the color combination of the red, green, and blue ray traces. Perhaps the most valuable information available from these images is their illustration of the camera`s depth of focus. If the image falling on the CCD detector is to be used for quality control, it must meet a minimum resolution requirement. If this image is a matchbox car moving on a conveyor belt, the depth of focus would be useful in determining the position of the car, source, and camera, as well as the instant of best focus for any part of the car.
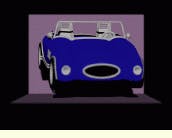
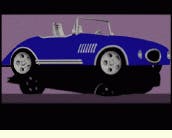
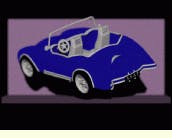
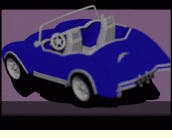
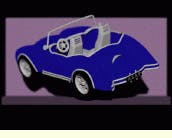
In a compilation of nine images, each formed by the color combination of three sets of 8 million ray traces, the images give a detailed assessment of the camera`s depth of focus (see Fig. 4). Seven of the images are created as a series. This is done by moving the car incrementally toward the camera throughout a range twice that of the camera`s 8-mm range of best focus. Because the car is more than four times the length of this range, some interpretation is needed to describe an acceptable image. In one image, the entire car is being resolved much better than the range of best focus predicted. This is a reminder that the Rayleigh criteria used to determine the range of best focus is flexible when used to describe the rate of defocus outside the range of best focus. Note the influence of object detail when resolving an image; detailed objects require higher resolution and are more sensitive to image degradation.
As defined by Rayleigh criteria, the visible spectrum`s range of best focus--in micrometers--is plus or minus the square of the camera`s f-number. The camera`s f-number is defined as its effective focal length divided by its entrance pupil diameter. When inside Rayleigh`s range of best focus, the ratio of the aberrated point-spread function`s peak irradiance to the unaberrated point-spread function`s peak irradiance, known as the Strehl ratio, is greater than 0.80. While outside of the range of best focus, the rate at which this ratio drops characterizes the rate at which defocusing occurs. Because every optical-vision system has unique values determining its formal range of best focus, it follows that every system will have a different rate of defocus outside of that range. Through the use of virtual simulation, it is possible to see the optical vision system`s true range for the resolution of a usable image.
In addition to providing information about the position of the light source, this analysis also yields information critical to the process of checking the model car for flaws. In this type of optical vision system, the image received by the CCD detector is relayed to a computer for a detailed inspection, during which the computer searches the image for hot spots in flux-per-unit-area that would distinguish the car`s highly reflective parts. If the light source lacks intensity or is misplaced, these hot spots may not be present in the image. Conversely, they may be washed out if the light source is too intense.
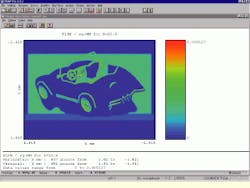
Virtual simulation plays an important role in allowing designers to choose and position the optical vision system`s light source in a manner appropriate for the dynamic range of the CCD camera. Figure 5 shows the designer`s method of evaluating the flux per CCD pixel in an image cast by a source of particular intensity and position. All the analysis and design procedures were performed with an off-the-shelf 200-MHz personal computer with 2 Gbytes of storage running under Microsoft Windows NT.
After both a car and optical-vision system have been modeled, they are imported or translated into the Advanced Systems Analysis Program, an optical and illumination, analysis, and design tool. Two independent translators are used: the initial graphics exchange specification formatted Rhinoceros translator for the computer-aided design entities and the ZEMAX translator for the lens entities.
FIGURE 1.Car model is constructed using the Rhinoceros three-dimensional graphical design software program. The car`s body is formed by lofting several of its cross-section curves (top left). A gray-scale rendering (bottom left) then depicts the completed computer-aided design model from four perspectives. Full-scale renderings (right) are made with the assigned object color and reflectance.
FIGURE 2.ZEMAX software tool is used for lens-design process. It simulates the optical-vision system needed to image the model car, which is a diffraction-limited, double-Gaussian imaging system (top left). Its performance is analyzed by means of a transverse ray-fan plot (top right), a spot diagram (bottom right), and a polychromatic diffraction modulation transfer function (bottom left).
FIGURE 3.After translation, the ASAP software verifies the imported three-dimensional geometry of the car model and light-source position (left) and of the imported lens entities (right).
FIGURE 4.This series of CCD images shows the image degradation due to the car model`s position within the imaging system`s range of best focus. These images are created by performing ray traces as the target object is moved. They accurately depict what a machine-vision system`s CCD camera might detect and also resemble snapshots of the target object as it is moved through the system`s focal range.
FIGURE 5.Optical-vision system designers can assess the position of the light source that illuminates the target object by analyzing the flux distribution incident on the system`s CCD detector. The ASAP software portrays the flux distribution per CCD pixel at "X" by means of its spectral plot features.
MICHAEL STEVENSON is an optical engineering consultant and MARIE Côté is a member of the optical engineering services group at Breault Research Organization Inc., Tucson, AZ 85715; [email protected]; [email protected].
