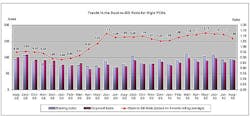
IPC August 2010 PCB results indicate increase year-over-year
IPC (Bannockburn, IL, USA) has released the August 2010 findings from its monthly North American Printed Circuit Board (PCB) Statistical Program.
PCB industry growth rates, B:B ratios
Rigid PCB shipments were up 24.3% while bookings increased 22.1% in August 2010 from August 2009. Year-to-date, rigid PCB shipments were up 20.4% and bookings have grown 33.2%. Compared to the previous month, rigid PCB shipments increased 5.4% and rigid bookings increased 1.5%. The book-to-bill (B:B) ratio for the North American rigid PCB industry in August 2010 remained positive but fell off slightly to 1.08.
Flexible circuit shipments in August 2010 were up 35.7%, and bookings were up 61.8% compared to August 2009. Year-to-date, flexible circuit shipments increased 9.2% and bookings were up 22.6%. Compared to the previous month, flexible circuit shipments decreased 7.6%, but flex bookings increased 12.9%. The North American flexible circuit B:B in August 2010 remained positive but fell to 1.01.
For rigid PCBs and flexible circuits combined, industry shipments in August 2010 increased 25.2% from August 2009, as orders booked increased 25.0% from August 2009. Year-to-date, combined industry shipments were up 19.5% and bookings were up 32.3%. Compared to the previous month, combined industry shipments for August 2010 increased 4.1% and bookings increased 2.5%. The combined (rigid and flex) industry B:B in August 2010 slipped to 1.07.
“Year-on-year sales growth continued in the double digits in August,” says IPC president and CEO Denny McGuirk. “The the book-to-bill ratio is positive for the 16th consecutive month, which indicates solid sales growth for the rest of 2010,” he adds. “Book-to-bill ratios have been trending downward since reaching a peak last May, especially in the flexible circuit segment, mainly due to strong sales growth.”
The book-to-bill ratios are calculated by dividing the value of orders booked over the past three months by the value of sales billed during the same period from companies in IPC’s survey sample. A ratio of more than 1.00 suggests that current demand is ahead of supply, which is a positive indicator for sales growth over the next two to three months.
Book-to-bill ratios and growth rates for rigid PCBs and flexible circuits combined are heavily affected by the rigid PCB segment. Rigid PCBs represent an estimated 89% of the current PCB industry in North America, according to IPC’s World PCB Production and Laminate Market Report.
The role of domestic production
IPC’s monthly survey of the North American PCB industry tracks bookings and shipments from U.S. and Canadian facilities, which provide indicators of regional demand. These numbers do not measure U.S. and Canadian PCB production. To track regional production trends, IPC asks survey participants for the percentage of their reported shipments that were produced domestically (i.e., in the USA or Canada). In August 2010, 83% of total PCB shipments reported were domestically produced. Domestic production accounted for 83% of rigid PCB and 81% of flexible circuit shipments in August by IPC’s survey participants. These numbers are significantly affected by the mix of companies in IPC’s survey sample, which changed slightly in January, but are kept constant through the remainder of the year.
Bare circuits versus assembly
Flexible circuit sales typically include value-added services such as assembly, in addition to the bare flex circuits. In August, the flexible circuit manufacturers in IPC’s survey sample indicated that bare circuits accounted for about 52% of their shipment value reported for the month. Assembly and other services make up a large and growing segment of flexible circuit producers’ businesses. This figure is also sensitive to changes in the survey sample, which may occur at the beginning of each calendar year.
Interpreting the data
Year-on-year and year-to-date growth rates provide the most meaningful view of industry growth. Month-to-month comparisons should be made with caution as they may reflect cyclical effects. Because bookings tend to be more volatile than shipments, changes in the B:Bs from month to month may not be significant unless a trend of more than three consecutive months is apparent. It is also important to consider changes in bookings and shipments to understand what is driving changes in the B:B.
The information in IPC’s monthly PCB industry statistics is based on data provided by a representative sample of both rigid and flexible PCB manufacturers in the USA and Canada. IPC publishes the PCB Book-to-Bill Ratio and the PCB Statistical Program Report each month. Statistics for the previous month are not available until the last week of the following month.
Source: IPC — Association Connecting Electronics Industries
-- Posted by Vision Systems Design

