Images acquired by 3-D ultrasound construct volume views
Images acquired by 3-D ultrasound construct volume views
Andrew Wilson
Editor at Large
Since the 1940s, two-dimensional (2-D) ultrasound has been used as a noninvasive and inexpensive imaging diagnostic tool. Already proven for applications such as fetal examination, abdominal tumors, cardiology, and aneurysm diagnosis, 2-D ultrasound imaging techniques provide an accurate spatial impression of an internal organ.
Using conventional 2-D techniques, however, an ultrasound-system operator has to intuitively visualize the three-dimensional (3-D) position of a patient`s anatomy. Now, with the addition of off-the-shelf positioning sensors, frame grabbers, and visualization software, researchers at the University of California, San Diego (UCSD; La Jolla, CA) are modifying conventional 2-D ultrasound-imaging systems to generate volumetric data of the inner structures of the body.
"Two-dimensional ultrasound is in routine use in nearly all American hospitals," says Thomas R. Nelson of the UCSD department of radiology. "But, while real-time 2-D systems are useful, there are occasions when it is difficult to develop a 3-D impression of a patient`s anatomy, for example, when a mass distorts the normal anatomy or when there are vessels or structures not commonly seen," he says. Abnormalities might be difficult to visualize with 2-D imaging because of the particular planes that need to be imaged. "For this reason," says Nelson "the integration of views obtained over a region of a patient with 3-D systems permits better visualization and allows a more accurate diagnosis to be made."
Adding a dimension
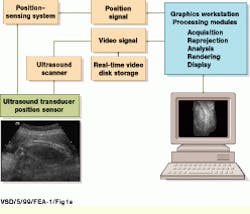
Using off-the-shelf, one-dimensional (1-D) transducer arrays, the 3-D ultrasound system developed at UCSD is based on a conventional ultrasound scanning system, the Acuson (Mountain View, CA) 128/XP-10. During system operation, gray-scale and color Doppler video-image data are captured by the Acuson system and delivered into a Sun Microsystems (Mountain View, CA) Sparc-10 graphics workstation using the XVideo 24-bit video digitizer from Parallax Graphics (Santa Clara, CA). Images are then stored to a high-speed digital video storage disk at 10 to 30 frames/s (see Fig. 1).
"To simplify the problem of accessing scanner image data," says Nelson, "we use the video image data from the Acuson system. However, this limits our ability to obtain scaling and offset information," he says. As a result, this information must be determined independently to reproject image planes into a volume data set. To do so, the position of each video frame is referenced to the patient`s position. "In the past," says Nelson, "a variety of systems were used to obtain position-tracking information including articulated arms, laser and infrared (IR) sensors, and electromagnetic positioning systems.
In the UCSD-developed system, a Fastrack six-degree-of-freedom electromagnetic position sensor from Polhemus (Colchester, VT) is attached to the ultrasound transducer to provide position and orientation information for each acquired image. For reference to the patient`s coordinate system, the imaging system uses a sensor located on the transducer and a reference point source. During operation, the reference point source transmits a time-coded waveform through each of three orthogonally positioned coils in sequence; the waveforms are detected by a sensor of similar design. "Although this method assumes that the only motion occurring during a scan is due to the transducer being moved across the patient," says Nelson, "it preserves the flexibility of free-hand scanning and does not require a mechanical scanning mechanism."
Both scanner performance and volume scanning resolution determine the position-sensing system performance. To produce a voxel resolution of 0.5 mm in a 200-mm field-of-view (FOV) sector transducer field at the most distant location, for example, the position sensor must have an angular resolution of at least 0.1° and a positional resolution of at least 0.25 mm. "At present," says Nelson, "these values exceed the capability of currently available positioning systems." Indeed, the positioning system used at UCSD has an angular resolution of approximately 0.5° and a position resolution of approximately 0.5 mm. These values translate into a pixel resolution of 0.88 mm at 100 mm and 1.75 mm at a 200-mm FOV.
Before scanning can begin, each video-image-pixel location must be related to a physical dimension. To determine these registration values, both image-scaling factors and the offset of each pixel from the transducer face and position sensor must be computed. Although this calibration procedure is straightforward, each transducer and each field of view must be calibrated using a test object.
Volumetric imaging
After the system is calibrated, a series of ultrasound signals sweeps through the anatomy and feeds the acquired data into the Sparc-10 graphics workstation. Depending on the type of patient study, images are acquired at either 10 or 30 frames/s and stored to disk. Development of volume data involves specifying the transducer and defining the acquisition limits. Next, a region of interest is drawn around the anatomy of interest, and the frames to be included in the reprojection are identified by the operator.
After the range of interest and range of images are selected, the Sparc-10 workstation determines the voxel scaling and offset factors for the volume matrix using the transducer`s calibration files. In this way, a cubic data matrix is generated with its physical dimensions determined by the maximum extent of the acquired data. "In the UCSD system, a 128 x 128 x 128-pixel matrix is used as a standard, but this can be increased or decreased depending on available memory and resolution requirements," says Nelson.
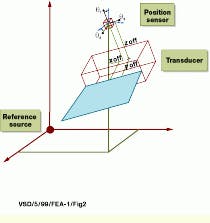
Pixel-to-voxel reprojection consists of converting each image pixel into a physical position and locating it in the volume matrix at the proper position (see Fig. 2). To perform this reprojection, each pixel-image-index location is converted to centimeters. After this, the pixel-position information is referenced to the sensor, and the distance from the reference source is added to obtain the volume position. Reprojection then results in all the voxels being directly referenced to a fixed point in the patient`s coordinate system.
Depending on the field of view and the rate of scanning, most volume data have small gaps where no scan data are obtained. This problem can be corrected by acquiring data very slowly and oversampling the volume of interest or by augmenting the data volume using estimation methods. Because acquiring images slowly generates large amounts of data and requires long scanning times, this approach is impractical in clinical applications. Instead, the UCSD system uses an algorithm that incorporates nearest-neighbor pixel information to estimate the proper voxel value.
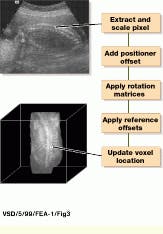
This algorithm successively reduces the matrix resolution by factors of two and replaces the data gaps with a valid voxel from the next-lowest resolution. If there is a gap at the next-lowest resolution, the process continues until a valid voxel is found. By performing the process recursively, large gaps in the volume are filled in with minimal compromise in data quality (see Fig. 3). After volume data are augmented, they are filtered using either a 3 x 3 x 3 Gaussian or median filter to improve the spatial coherence and the signal-to-noise ratio. "In general," says Nelson, "median filters provide better results than Gaussian filters, particularly for reducing speckle noise while preserving resolution."
Measuring volumes
To allow physicians to make volumetric measurements, images are masked using either individual plane masks or an interactive electronic scalpel. After the object is masked, voxels are summed and matrix voxel-scaling factors are used to determine the volume. According to Nelson, this permits measurement of regular, irregular, and disconnected objects with an accuracy of better than 5%.
To perform volume-data analysis, data volumes are first resliced to find the optimum viewing plane. Cut planes can be viewed from any orientation in the area of interest. For comparison and localization purposes, the UCSB system simultaneously displays three intersecting orthogonal views through a common point selected by the viewer. This volume can be examined by scrolling through parallel planes from the initial orientation, including orthogonal planes. "Viewer comprehension is improved by reorienting the volume data to a standard anatomic orientation," says Nelson.
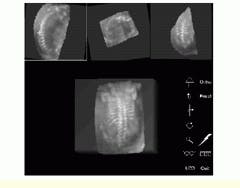
Using the interactive renderer, the viewer may interactively rotate and zoom the data volume to optimize the display orientation (see Fig. 4). Target organ visualization is enhanced using a 3-D electronic scalpel that can interactively extract tissues or organs of interest from the rest of the volume. Using the electronic scalpel, the viewer can slice away sections of the data volume to isolate the anatomy of interest, rather than using slower single-plane masking techniques.
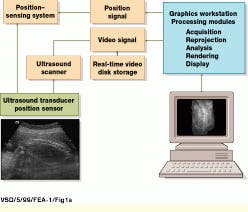
FIGURE 1. In building a three-dimensional ultrasound imaging system, USCD researchers digitize video data acquired from an Acuson 128/XP-10 ultrasound scanning system using a 24-bit, S-bus-based video digitizer and deliver the processed data into a Sun Microsystems Sparcstation-10 graphics workstation. Three-dimensional positional information is obtained by coupling the system`s ultrasound transducer with a six-degree-of-freedom electromagnetic positioning sensor. (Image courtesy John Wiley & Sons, International Journal of Imaging Systems and Technology 8, 26-37, 1999)
FIGURE 2. To compute the location of an image pixel in a volume referenced to a fixed location in a patient`s reference system, a position sensor provides x, y, and z distance information from the source as well as three rotation angles that reference the orientation between the source and the sensor. Transducer scan-plane, image, and position sensor offsets are also required to locate an image pixel in the patient`s co-ordinate system. (Image courtesy John Wiley & Sons)
FIGURE 3. To map each pixel in a two-dimensional ultrasound image to a volume-data matrix, each pixel is extracted and scaled, position offset is added, and rotation matrices are applied. Then, reference offsets are applied and the voxel is represented in three-dimensional space. (Image courtesy John Wiley & Sons)
FIGURE 4. Using an interactive renderer, the viewer may interactively rotate and zoom the data volume to optimize the display orientation. Orthogonal slices from the rendered volume are shown (top) with the white cross representing the point of common intersection between planes. Note that the volume-rendered data are visible (bottom). (Image courtesy John Wiley & Sons, International Journal of Imaging Systems and Technology 8, 26-37, 1999)
Company Information
Acuson
Mountain View, CA 94039
(650) 969-9112
Web: www.acuson.com/
Parallax Graphics Inc.
Santa Clara, CA 95051
(408) 727-2220
Fax: (408) 727-2367
Polhemus
Colchester, VT 05446
(802) 655-3159
Fax: (802) 655-1439
E-mail: [email protected]
Web: www.polhemus.com/
Sun Microsystems
Mountain View, CA 94303
(800) 555-9SUN
Web: www.sun.com/
University of California, San Diego
La Jolla, CA 92093
(619) 534-1434
Fax: (619) 534-6950
E-mail: [email protected]
Web: www.tanya.ucsd.edu/
